

Can an Astro Indicator Identify Gold Market Turning Points
Gold market mein strong rally aur sudden correction dono common hain. Such movement often makes traders search for early turning-point signals. The supplied video presents one financial-astrology indicator for that purpose. It studies selected degree markers, signal candles, and later breakouts. However, the examples remain demonstrations, not independently verified predictions.
This article explains the speaker’s method in practical language. It also separates observation, interpretation, and actual trade execution. Yeh distinction important hai because attractive historical charts can create confidence. A disciplined learner still needs confirmation, position sizing, and documented testing. No indicator can remove uncertainty from a live market. The views and study presented in the video belong to Sanjay Kumar, founder of Smart Astrology. He also writes for LogicIQ Pro Academy, but LogicIQ Pro Academy is not affiliated with the views expressed in the video and does not endorse them.
1. What the Video Calls a Gold Market Astro Indicator
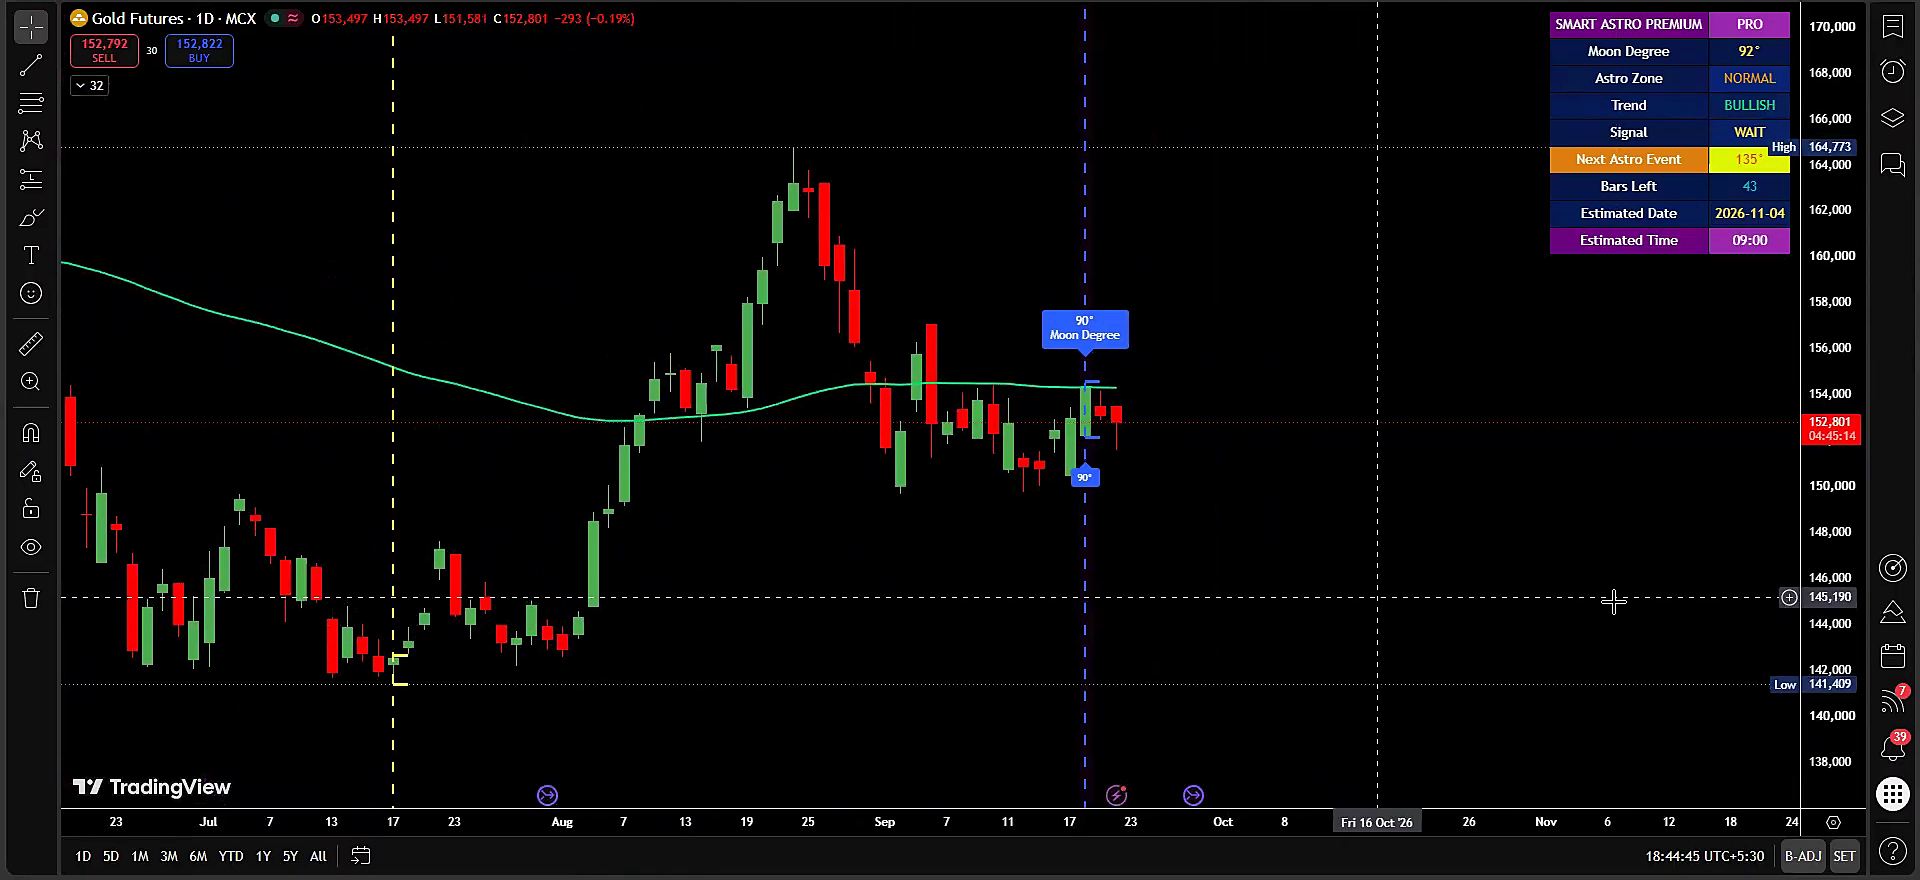
The indicator described in the video places astrology-based degree signals automatically. These signals may appear as zero, ninety, or 180-degree markers. A line is then associated with the relevant candle. The speaker treats that candle’s high and low as reference levels. Price direction is considered only after a later breakout occurs.
Simple language mein, the marker does not complete the setup. It identifies a candle requiring closer observation. The trader then watches whether price closes or moves beyond its range. This makes the approach closer to a breakout framework than prediction alone. The market, not the degree label, supplies the eventual direction.
2. The Core Workflow Shown in the Video
| Stage | What the Video Demonstrates | Responsible Interpretation |
| Signal | A degree marker appears near one candle | Treat it as a research alert |
| Range | Mark that candle’s high and low | Create objective reference levels |
| Breakout | Observe which boundary price crosses | Wait for market confirmation |
| Risk | Use the opposite level or prior candle | Calculate risk before entry |
| Review | Study what happened afterwards | Record winners, failures, and costs |
Video mein astro support and astro resistance terms appear repeatedly. They refer to levels created from the selected candle’s range. A bullish break is presented as a possible buying setup. A bearish break is presented as a possible selling setup. Yet a valid visual breakout can still reverse quickly afterwards.
How to Read the Chart Without Overinterpreting It
Begin with the signal candle, not the later outcome. Mark its exact high and low before scrolling forward. Then note when price first crosses either boundary. A wick beyond the level may behave differently. A closing breakout creates another testable rule altogether.
Next, inspect the surrounding market structure carefully. Check whether price was trending, ranging, or highly volatile. Notice nearby swing highs, lows, and consolidation zones. Yeh context signal ko stronger ya weaker prove nahi karta. It simply creates categories for later comparison.
Finally, separate observation from the decision itself. A marker is an observation requiring further evidence. A breakout is another observable market event. Entry, quantity, and stop placement are separate decisions. Keeping these stages distinct reduces impulsive interpretation.
3. Historical Gold Examples Discussed by the Speaker
The speaker reviews several dates across different chart periods. These include May 15, 2026, January 8, 2026, June 30, 2025, December 20, 2024, and August 14, 2024. On the displayed charts, selected signal candles are followed by directional moves. Some examples show upside breakouts, while others show downside movement.
These dates should be described as video examples only. The transcript does not provide a complete, downloadable dataset containing every signal. It also does not report transaction costs, slippage, missed entries, or standardized results. Therefore, no success percentage should be calculated from those illustrations. Selective historical examples cannot establish dependable future performance.
4. Why Backtesting Needs More Than Attractive Charts
A proper backtest begins with rules written before outcomes are viewed. Those rules should define the instrument, timeframe, signal calculation, breakout condition, entry method, stop-loss, exit, and trading costs. Every qualifying signal must be recorded, including failures. Otherwise, hindsight may influence which examples receive attention.
Testing ko separate periods mein divide karna bhi useful hai. First, build rules using an initial historical sample. Next, evaluate them on untouched data. Finally, observe signals prospectively without changing definitions midway. This process cannot guarantee future results. It simply produces more reliable evidence than chart selection alone.
5. Entry and Stop Loss Method Presented in the Video
For an upside breakout, the video discusses entry after confirmation. The previous candle’s low may then serve as a reference stop. For a downside breakout, the previous candle’s high may become relevant. Another possibility uses the opposite marked boundary. These are speaker-described examples, not personalised trading instructions.
Before entering, traders must convert that distance into rupee risk. A wide positional stop requires a smaller quantity than a narrow stop. Agar position size unchanged rahe, a wider stop increases potential loss. Maximum risk should therefore be decided before execution. Moving a stop casually can invalidate the original plan.
6. False Breakouts Are Part of the Method’s Reality
Importantly, the transcript includes unsuccessful examples. In one case, price breaks downward before returning upward and hitting the stop-loss. The speaker advises accepting that loss and respecting predetermined risk. This admission matters because any honest indicator discussion must include failures alongside favourable movements.
A breakout may fail because volatility expands, liquidity changes, or price briefly crosses a level. Traders sometimes add closing confirmation, retest behaviour, volume, or broader structure. Such filters can also delay entries and miss moves. Their usefulness must be tested consistently rather than added after each disappointing outcome.
A Simple Risk Example for Educational Understanding
Assume a planned entry sits ten points above risk. If one point represents one rupee, each unit risks ten rupees. A hundred units would therefore risk one thousand rupees. Charges and slippage can increase the final amount. The quantity must reflect the trader’s predefined limit.
Now suppose the stop distance doubles to twenty points. Keeping one hundred units would double planned price risk. Reducing quantity can keep total exposure more consistent. Is calculation mein profit prediction bilkul involved nahi hai. It only controls damage when the setup fails.
The same principle applies to positional and intraday trades. Wider stops usually require smaller position sizes. Leverage can magnify losses beyond casual expectations. Never select quantity because one historical chart looked convincing. Risk must remain affordable across several consecutive failures.
7. Positional Trading and Intraday Trading Need Different Tests
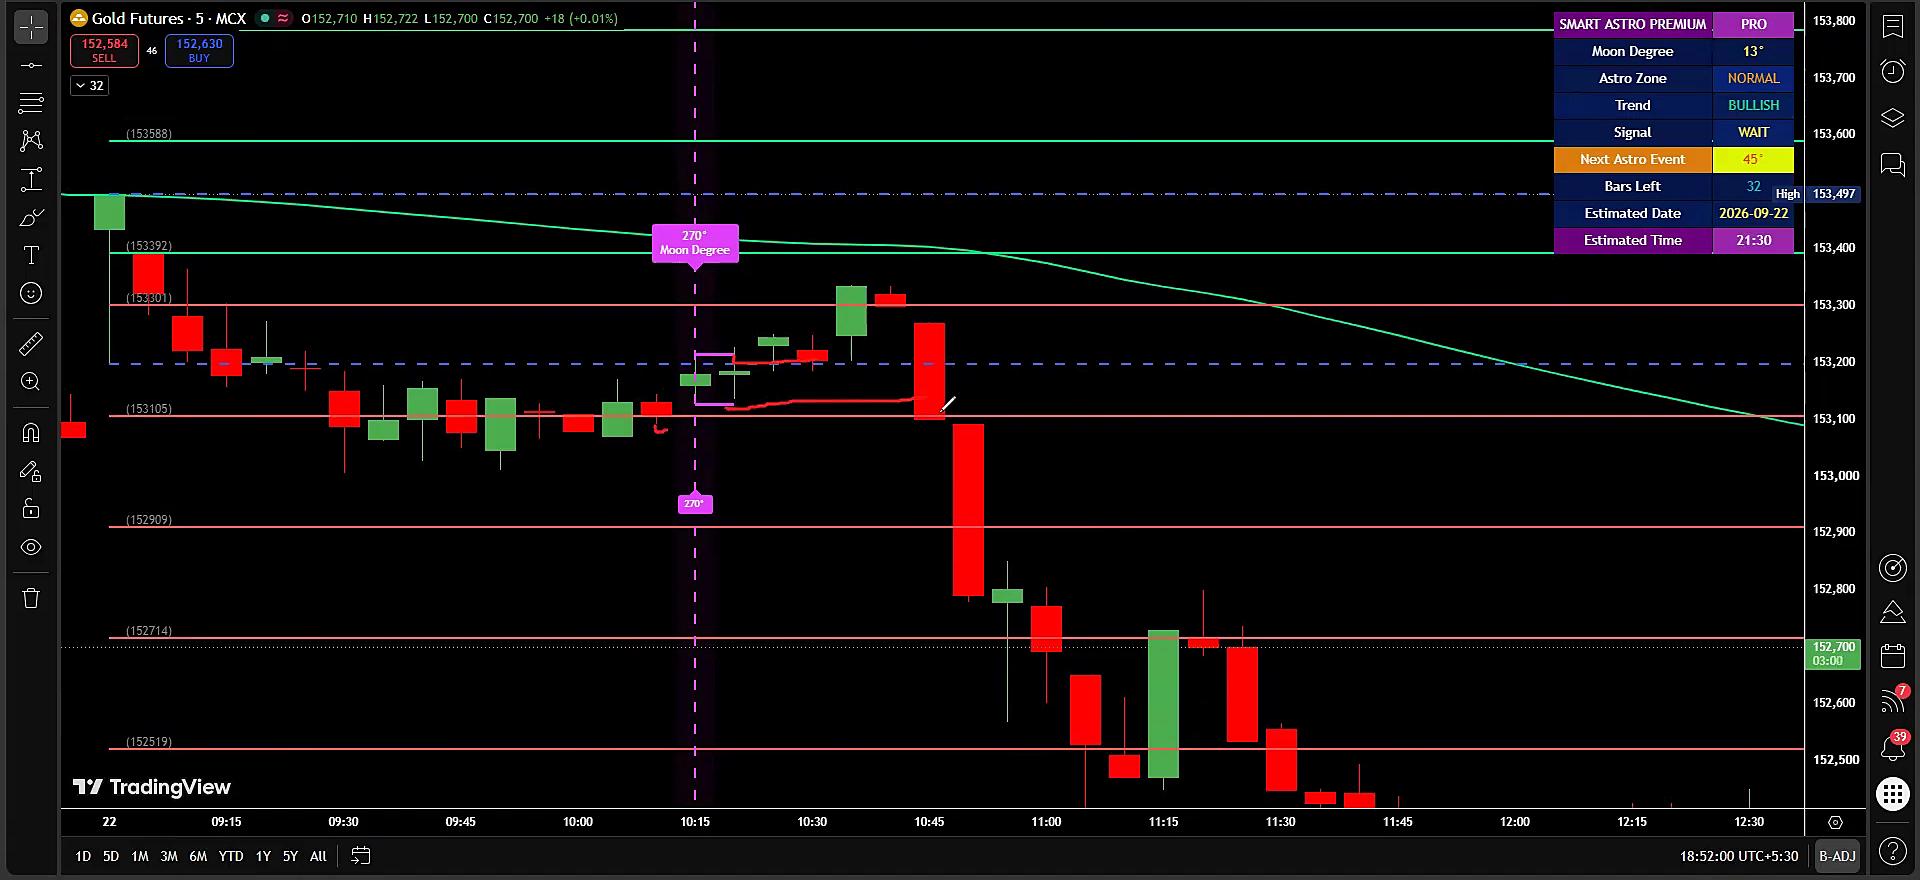
The video initially emphasises positional gold trading because gold can move sharply. Positional setups normally tolerate wider fluctuations and longer holding periods. Intraday examples are later demonstrated on shorter timeframes. Ek rule ko directly another timeframe par apply karna misleading ho sakta hai. Market noise and execution costs change significantly.
Each timeframe therefore needs separate evidence and risk limits. Positional testing should consider overnight gaps and carrying exposure. Intraday testing should include spreads, frequent signals, and rapid reversals. A strategy appearing orderly on daily candles may behave very differently on fifteen-minute charts.
8. Gold, Nifty, Bank Nifty, Bitcoin and Forex Examples
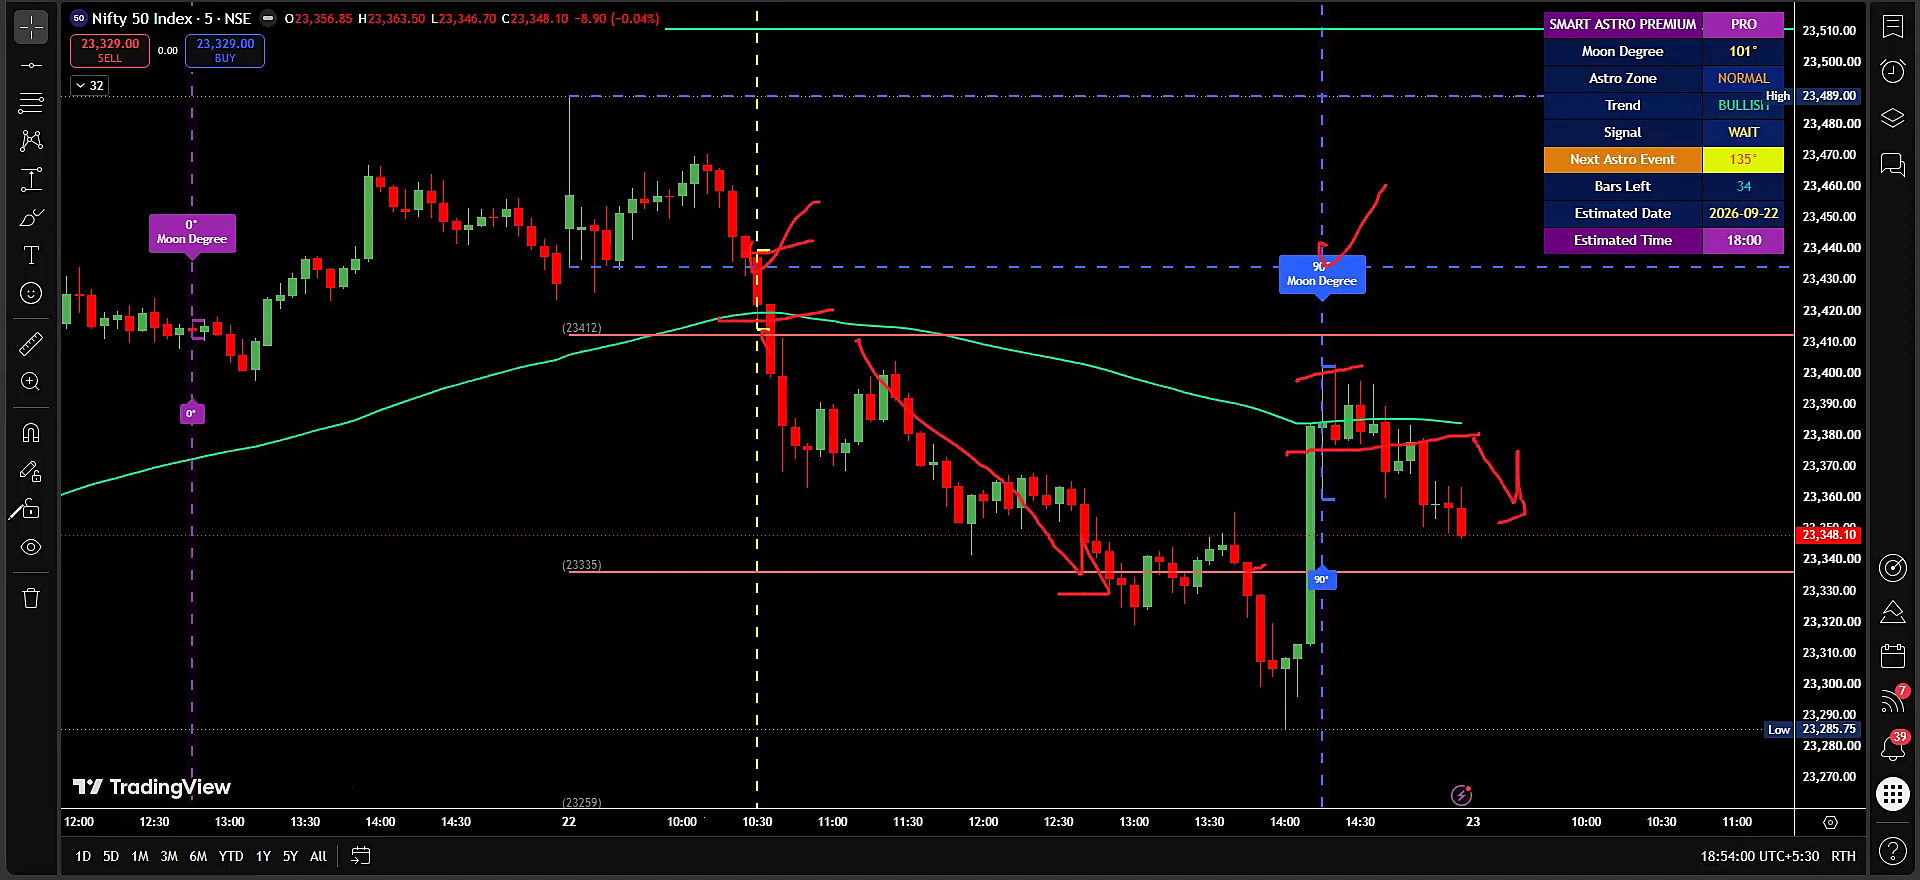
Beyond gold, the speaker displays Nifty, Bank Nifty, Bitcoin, forex, and USD gold charts. The same broad process is applied: locate a degree signal, mark a candle range, and observe the subsequent break. This demonstrates possible portability, but it does not prove equal effectiveness across instruments.
Every market has different trading hours, liquidity, gap behaviour, leverage, and news sensitivity. Bitcoin trades continuously, while Indian indices follow exchange sessions. Forex and gold may react strongly to global economic releases. Consequently, performance from one market cannot be transferred automatically to another.
9. What the Degree Labels Do Not Tell You
A zero, ninety, or 180-degree label does not state guaranteed direction. According to the demonstrated workflow, direction becomes relevant only after price leaves the marked range. The degree marker also cannot explain upcoming news, unexpected policy decisions, liquidity shocks, or execution quality. Those factors remain outside the indicator.
Isliye indicator ko standalone certainty machine samajhna unsafe hoga. Its most defensible use is as a structured observation framework. Traders can ask whether signals coincide with meaningful ranges, whether breakouts persist, and how often stops occur. Answers require complete records, not confidence created by several memorable charts.
10. A Responsible Validation Checklist
Start by freezing the exact indicator version and calculation settings. Record the data source, timezone, contract, timeframe, and date range. Define what counts as a signal and valid breakout. Specify entry timing, stop placement, target logic, and maximum holding period. Include brokerage, taxes, spreads, slippage, and financing where applicable.
Then record every occurrence without removing inconvenient cases. Compare results across trending, ranging, and high-volatility conditions. Review maximum drawdown, average win, average loss, and consecutive losses. Forward testing with paper trades can reveal live execution problems. Only after sufficient evidence should real capital even be considered.
11. Common Mistakes Traders Should Avoid
The first mistake is entering immediately when a marker appears. The video itself uses the later breakout for direction. Another mistake is studying only favourable outcomes. Traders may also ignore costs, change stops, overtrade repeated signals, or use excessive leverage. These behaviours can overwhelm even a promising historical pattern.
A third mistake is confusing a chart explanation with investment advice. Educational demonstrations do not know the reader’s capital, income, obligations, or risk capacity. Do not borrow money for trading. Avoid assured-return language and unregistered advice. Protect login details and use regulated intermediaries for applicable market transactions.
12. How a Trading Journal Strengthens the Review
A trading journal should capture the degree signal, candle range, breakout time, entry, stop, quantity, exit, costs, and chart evidence. Add whether the breakout closed beyond the range or only crossed briefly. Over time, these fields help distinguish repeated behaviour from isolated examples and emotional memory.
For a complete journaling workflow, read What Is a Trading Journal and What Can Your Own Trading Data Teach You. It explains how structured records support historical self-review without predicting the next trade.
13. Practical Questions Before Using Any Market Indicator
| Question | Why It Matters |
| Are the rules defined before testing? | Prevents hindsight from changing the setup |
| Were all signals recorded? | Reduces favourable-example selection |
| Are losses and costs included? | Shows a more realistic net result |
| Was untouched data tested? | Checks whether rules generalise |
| Is risk fixed before entry? | Limits damage when breakouts fail |
| Is the provider appropriately registered? | Supports safer, accountable decision-making |
14. Where Beginners Should Start
Beginners should first understand chart structure, order types, leverage, and position sizing. They can study indicator signals on historical charts without placing trades. Next, paper trading may help test whether rules are practical. Real money should never become the first testing environment for an unfamiliar method.
New learners can begin with What Is the Stock Market A Complete Beginner’s Guide for Indians. Those opening an account can also review the verified Demat guide before choosing a broker or depository participant.
Read How to Open a Demat Account in India in 2026 for the required documents, charges, and account-opening precautions.
15. Frequently Asked Questions
Does the video guarantee gold will reach a new high
No. The title asks that question, while the transcript demonstrates historical signals. Neither historical movement nor an indicator can guarantee a future gold price.
Does an astro degree signal provide immediate direction
Not within the demonstrated workflow. The speaker first marks the signal candle. Direction is then considered after price breaks its high or low.
Can the same settings work across every market
That cannot be assumed. Gold, indices, Bitcoin, and forex behave differently. Each instrument and timeframe needs separate testing, costs, and risk controls.
What happens when the breakout fails
The video includes stop-loss examples. A failed breakout should remain in the record. Predetermined risk and disciplined exit rules become essential during reversals.
Should beginners trade this indicator immediately
No. Beginners should learn market basics, document exact rules, backtest complete samples, and paper trade first. Real capital always carries loss risk.
Is this article investment or trading advice?
No. This article explains the supplied video for education only. It does not recommend any security, position, entry, exit, target, or stop-loss. Readers should consult a SEBI-registered professional before any financial decision.
Conclusion
The video presents a clear observation sequence: identify an astrology-based degree signal, mark the selected candle’s range, wait for a breakout, and manage the opposite side as risk. It also acknowledges failed breakouts and demonstrates the idea across several markets. Those elements make the method understandable, but not proven.
Best approach yeh hai: curiosity ko evidence ke saath combine karein. Keep rules fixed, record every result, include costs, and protect capital. Treat financial astrology as a hypothesis requiring testing, never as guaranteed direction. Markets remain uncertain, and disciplined risk management must remain central.
| ⚠ IMPORTANT EDUCATIONAL DISCLAIMER | |
|
Official Sources Consulted
SEBI Investor: Do’s and Don’ts of Investing in the Securities Market
SEBI Investor: Factors to Consider Before Investing
SEBI Investor: How to Manage Investment Risks
SEBI investor education material: Secondary Market Guidance