

You Know Your P&L. But Do You Know Your Trading?
Most traders know whether their latest trade earned or lost money. Yet P&L alone cannot explain how that outcome developed. Which setup do you execute most consistently across comparable trades? When do rushed entries, changed stops, or early exits appear? Does your paper-trading behaviour differ from actual market execution?
A broker statement confirms transactions, quantities, prices, charges, and account movements. It cannot preserve your original setup, confidence, chart context, or reasoning. A trading journal adds that missing decision layer around every trade. It records what you planned, executed, observed, and learned afterwards.
One profitable trade may still contain careless execution and uncontrolled risk. Similarly, one planned loss may reflect disciplined rule-following under uncertainty. Journaling helps separate process quality from a single financial outcome. The central workflow remains simple: RECORD → REVIEW → ANALYSE → LEARN.

A trading journal connects market decisions with written evidence.
1. What Is a Trading Journal?
Simple language mein, a trading journal is your structured trading diary. It records plans before entry and evidence after execution. Useful entries capture instrument, strategy, timeframe, entry reason, planned risk, result, emotions, chart evidence, and one practical lesson.
Written evidence matters because memory changes after outcomes become visible. Winning trades often receive generous explanations, while losses attract convenient excuses. Timestamped notes preserve what you genuinely believed before later information appeared. This makes reviews more factual, comparable, and personally useful.
| Core Positioning Do not use a trading journal only to record P&L. Use it to understand your own trading behaviour. |
2. What Should You Record Before, During, and After?
Before entry, document the strategy, timeframe, entry reason, planned entry, stop-loss, target, quantity, and acceptable rupee risk. During execution, record meaningful changes and their supporting reasons. After exit, add the exit price, exit reason, costs, result, chart link, remarks, emotions, and lesson.
| Stage | Important Evidence | Review Purpose |
| Before | Setup, timeframe, entry, SL, target, quantity | Tests whether a complete plan existed |
| During | Actual entry, timing, changes, trade management | Compares planned and actual execution |
| After | Exit, result, chart URL, emotion, lesson | Creates evidence for future reviews |
Use consistent field names across every record. Consistency allows comparable trades to be grouped later. Entry and exit prices alone remain insufficient because they omit intent. The journal should preserve the why behind each decision.
3. Risk Management and R-Multiple
Risk management becomes measurable when exposure is decided before entry. Record planned rupee risk, percentage risk, position size, and expected reward. Afterwards, compare planned risk against the amount actually experienced. This comparison may reveal repeated changes requiring closer process review.
One R represents the initial risk accepted before entering. If planned risk equals Rs 1,000, a Rs 1,500 gain equals +1.5R before relevant costs. A controlled Rs 1,000 loss equals -1R. R-multiples compare differently sized trades without confusing larger positions with better execution.
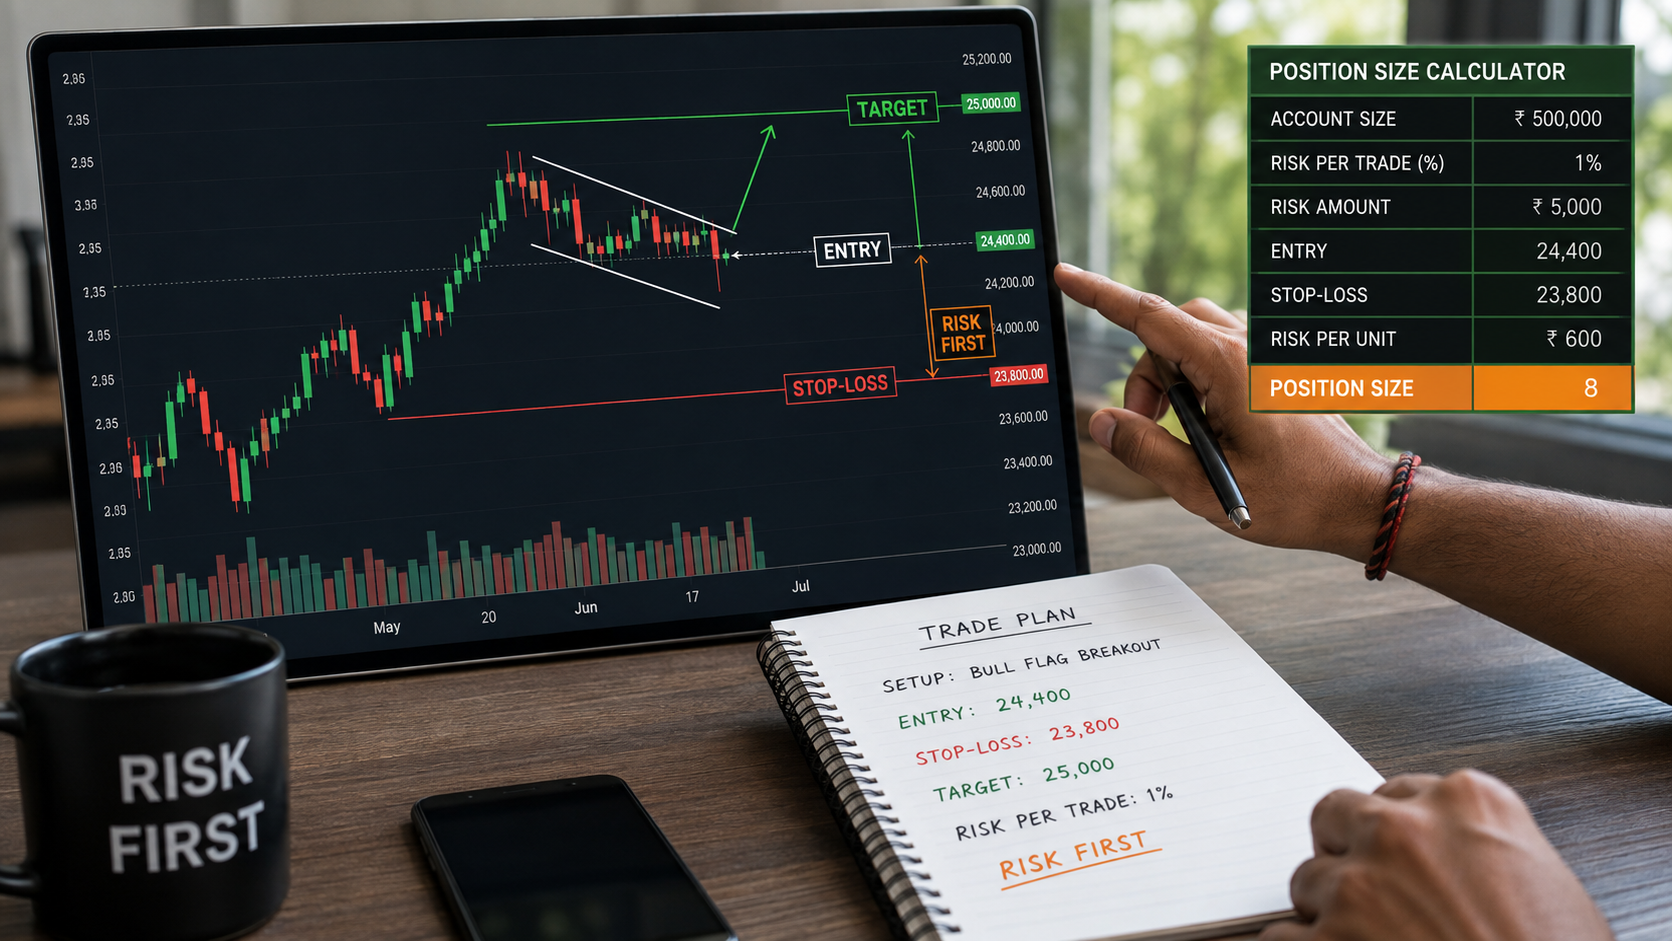
Define risk before entry, then compare planned and actual execution.
4. Paper Journal, Spreadsheet, or Digital Journal?
| Format | Main Strength | Possible Limitation |
| Paper notebook | Encourages slower reflection | Searching and calculations remain difficult |
| Spreadsheet | Supports formulas and filters | Setup and maintenance require consistency |
| Digital journal | Connects tags, charts, notes, and analytics | Incomplete entries still weaken every review |
Beginners can start simply, but a structured digital journal reduces scattered records. The tool should organise evidence, not predict markets or select trades. Accurate entries remain more valuable than impressive dashboards built from incomplete information.
5. Introducing the LogicIQ FREE Trading Journal
LogicIQ developed a structured digital Trading Journal inside its Institutional Trading System ecosystem. It helps users document and review their own paper trades and actual executed trades. The tool supports record keeping, historical self-review, data organisation, process review, educational learning, and behavioural awareness.
It does not provide stock recommendations, live trading calls, assured returns, market predictions, or personalised investment advice. Its purpose is practical self-journaling. Users supply their own trading records, and the resulting analytics remain historical observations rather than forecasts.
How to read this screen
Before the analytics make sense, it helps to know what the main screen of a free trading journal actually does. It filters your own recorded history by user, trade type and date range, then summarises what those records contain — a total for the selected period, and a split between winning and losing days.
The sample screen below covers 01–31 March 2026 and summarises nine recorded trading days. Notice what the screen does not do. It makes no statement about your next trade, the coming month, or any instrument. It reports only what was entered into it.
Ask your own data: Over my last complete month, how many days did I actually record? Is my average loss on losing days close to the risk I planned before entry, or well beyond it?
Illustrative screenshot from a sample user account. Figures shown are historical, user-recorded entries for demonstration only and do not indicate expected, typical or future results.
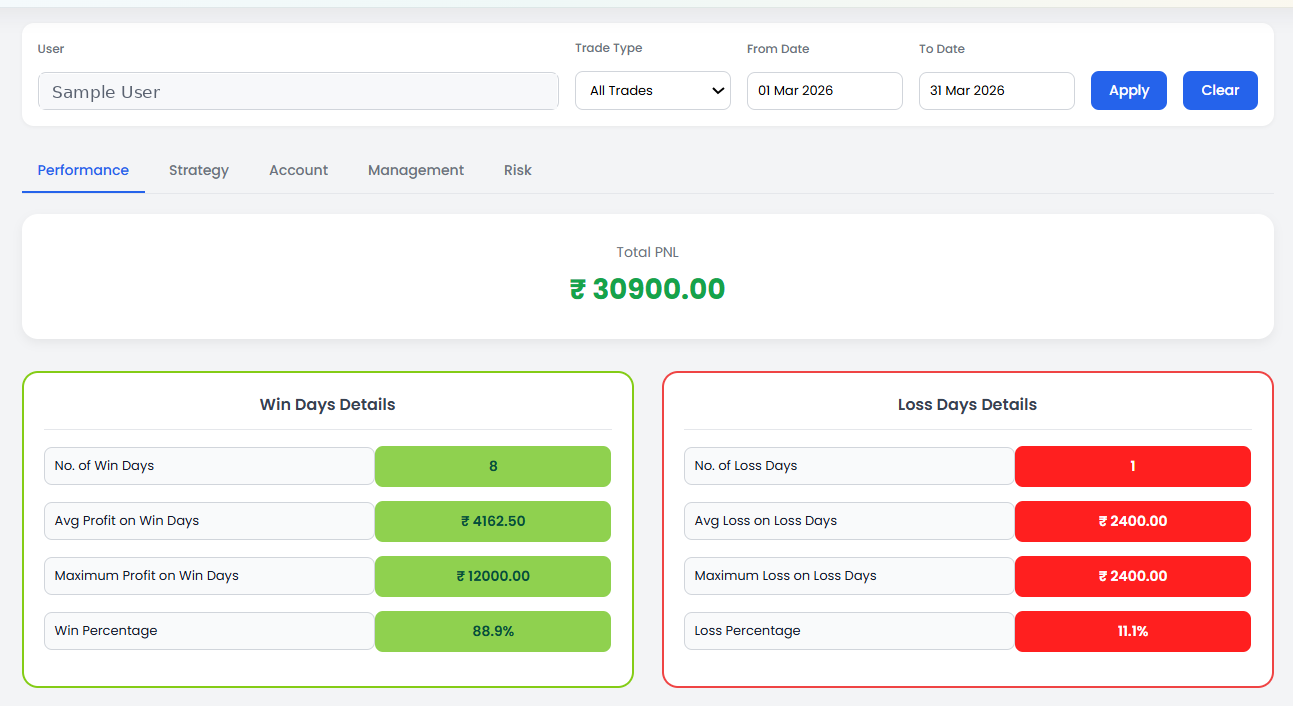
The LogicIQ FREE Trading Journal organises personal trade records for systematic review.
6. Record Different Instruments Through Relevant Fields
The journal can accommodate stocks, swing or delivery trades, intraday trades, index futures, stock futures, index options, and stock options where applicable. Relevant fields appear according to the selected instrument, helping each record capture appropriate contract and execution details.
An options entry may include the index or instrument, expiry, call or put, strike price, buy or sell direction, entry price, quantity, and trade time. Strategy tags can organise personal records using Box Theory, Ramban Setup, UOP Premium, breakout, reversal, or other learner-available strategies.
These strategy tags do not represent performance claims. They simply categorise the user’s historical entries for later comparison. A trader can then examine whether execution differs across strategies, instruments, timeframes, sessions, or trade types.
A worked example: recording one options trade
A trading journal for options needs more fields than an equity entry, because the contract itself carries assumptions. Suppose a learner takes an index options trade and wants the record to still make sense a year later. The fields below carry the plan; the last two are added only after the position is closed.
| Field | Example entry | Why it matters at review |
| Instrument | NIFTY | Groups the record with comparable trades |
| Expiry | 26 Mar 2026 | Separates weekly from monthly behaviour |
| Option type | Call (CE) | Records the directional assumption made |
| Strike | 24,400 | Shows how far from spot you chose to trade |
| Direction | Buy | Defines what the position needed to happen |
| Entry price | ₹118 | Anchors the R-multiple calculation |
| Quantity | 2 lots | Converts the price move into rupee risk |
| Trade time | 09:52 | Feeds the time-wise view shown later |
| Strategy tag | Breakout setup | Groups the record for strategy review |
| Entry reason | Breakout confirmed above range high | The commitment you will test later |
| Stop-loss | ₹96 | Defines 1R before entry |
| Target | ₹162 | States the reward planned in advance |
| Exit price | ₹141 | Completes the record |
| Exit reason | Partial target, momentum slowed | Explains the decision, not just the number |
Recorded this way, the entry answers a question months later that no broker statement can — not what happened, but what you expected and whether you followed it. An entry missing the stop-loss, the entry reason or the exit reason cannot really be reviewed. It can only be counted.
7. Turn Every Trade Into a Case Study
A TradingView chart URL can be preserved with each journal entry. Months later, the trader can revisit the chart’s original context. They can review the perceived setup, planned stop, expected target, subsequent movement, and whether written reasoning matched visible chart evidence.
This turns a completed trade into a reusable personal case study. Screenshots or chart links can also expose hindsight-based storytelling. However, reviewing earlier charts does not guarantee better performance. It provides evidence for a more structured learning conversation.
How to review a saved chart later
A saved link is only useful if you review it with a method. A simple four-step pass works well:
- Read your own note first, before opening the chart. What did you say you saw?
- Open the chart and mark your planned entry, stop and target. Were they where you remember them?
- Cover the right side of the chart. Look only at information that existed before your entry. Would the same setup still be visible?
- Now reveal the rest, and compare what happened against what you wrote.
Most hindsight hides in step three. A setup that looks obvious with the full chart visible, but disappears when the right side is covered, was not a setup you traded — it is a pattern you recognised afterwards. Repeat this across enough comparable entries and the difference becomes something you can measure instead of something you feel.
8. Paper Trading Versus Actual Trading
LogicIQ provides separate categorisation and filtering for paper trades and actual trades. This distinction creates a useful comparison without automatically diagnosing the trader. It lets users investigate whether planning and execution remain similar when real capital and market pressure become involved.
| Review Area | Paper Trade Example | Actual Trade Example |
| Entry | Planned entry followed | Entry possibly delayed or chased |
| Stop-loss | Predefined SL maintained | SL possibly changed during execution |
| Exit | Planned target followed | Position possibly exited early |
| Selection | Only qualified setups recorded | Additional impulsive trades may appear |
Such differences do not automatically explain why they occurred, but they give the trader concrete evidence to investigate during review. The comparison should guide questions, not labels. It can show where planned behaviour and actual execution require deeper examination.
Reading the difference without diagnosing yourself
The comparison only works if both sides are recorded with equal honesty. A paper trading journal tends to flatter for a structural reason: entries are usually made when the trader is calm, and skipped when the trader is busy or the setup was unclear.
So before comparing results, compare counts. If your paper history holds forty entries and your actual history eleven, the two sets are not yet comparable. Then work through them in this order:
- Trade count — am I recording both sides with the same discipline?
- Selection — do the same setups appear on both sides?
- Entry — is the actual entry further from the planned entry?
- Stop-loss — was the recorded stop the one planned before entry?
- Exit — were planned targets reached, or were positions closed earlier?
Only after those five does a result comparison carry any meaning. And even then, the journal reports that a difference exists — it does not explain why. The explanation is what your review is for.
| Want to compare your own paper and actual records this way?
The LogicIQ Trading Journal is FREE to start. Record both trade types, filter them separately, and review your own execution side by side. → START YOUR FREE TRADING JOURNAL |
9. What Can Your Trading History Teach You?
Accumulated journal entries can be organised into total trades, winning trades, losing trades, win percentage, loss percentage, monthly P&L, yearly P&L, open trades, and closed trades. Historical summaries may also organise strategy-wise, setup-wise, day-wise, time-wise, and risk-reward observations.
The purpose of these analytics is not to predict the next trade. They organise historical journal records so that the trader can review their own behaviour and execution more systematically. Strong conclusions require sufficient comparable observations across relevant conditions.
| Question for Your Data | Evidence to Compare |
| How have breakout and reversal records differed? | Comparable setup-tagged trades |
| When do I take most trades? | Day-wise and time-wise entries |
| How closely does actual risk match planned risk? | Planned SL, actual exit, and quantity |
| Which mistakes appear repeatedly? | Remarks, rule scores, and exit reasons |
| Do paper and actual records differ? | Trade-type filters across similar setups |
The six views below come from one sample user’s journal history. Read each one as a way of questioning your own process — not as a result to reproduce. In every case the journal is reorganising records the trader created; it is not adding any information the trader did not already supply.
Day-wise P&L — did one session decide your month?
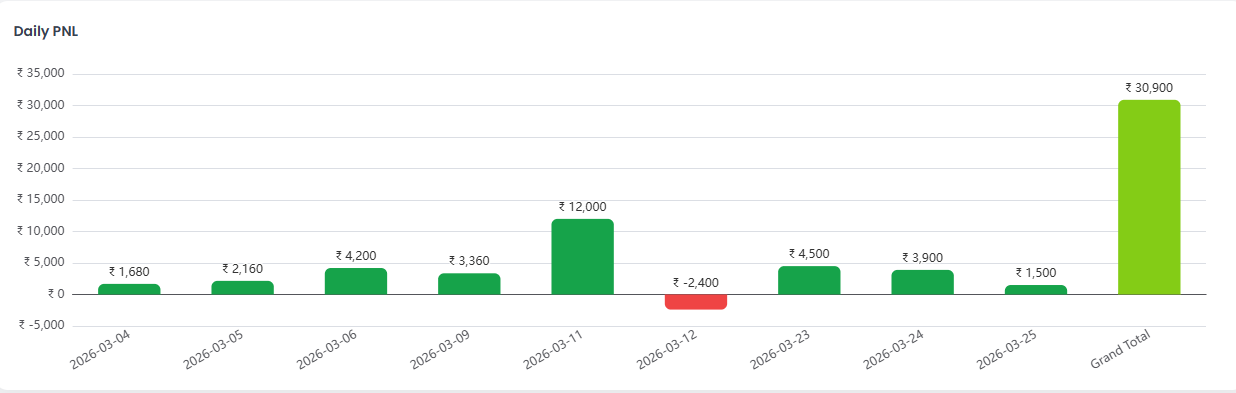
Every closed entry carries a date, so the journal can total your recorded result day by day. This is the simplest honesty check in any trading performance review. Most traders remember a month as a single feeling — “March was good.” The day-wise view breaks that feeling back into the individual sessions that produced it.
In the sample record, eight recorded days are positive and one is negative, and a single day (₹12,000) accounts for a large share of the ₹30,900 period total. That concentration is worth noticing. A month carried by one or two outsized days reflects a different process from a month built out of many similar-sized days, even when the totals look identical.
Ask your own data: How many of my recorded days actually carried the period? If I set aside my single best day, what does the rest of the record look like? Did my losing days stay near the risk I planned, or did one of them run well past it?
Month-wise P&L — is something repeating, or is it just noise?
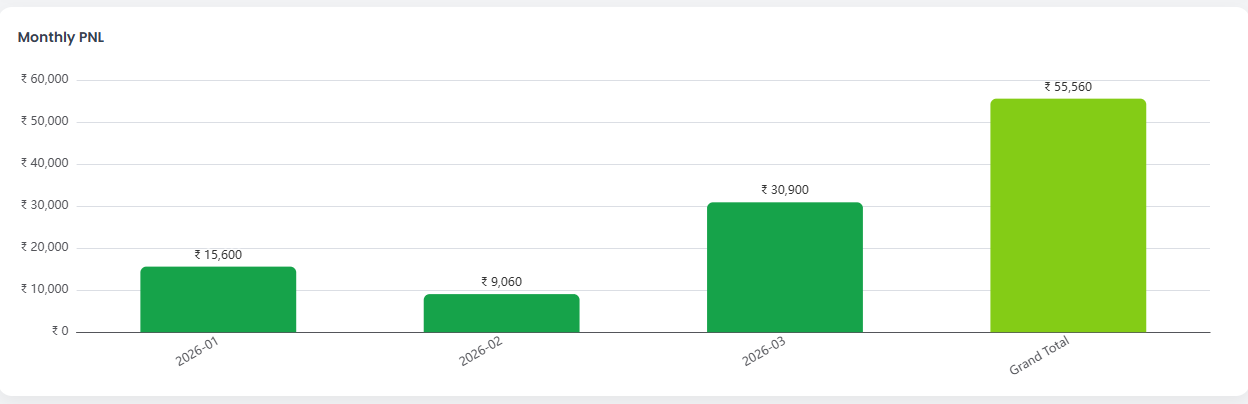
A single month is rarely a large enough sample to judge anything. Rolling the same entries up by month turns a daily trading diary into a longer view of the same records, and repetition is the only thing that separates a pattern from a coincidence.
The sample shows ₹15,600, ₹9,060 and ₹30,900 across three consecutive months. Three months is still a small sample, but it supports a different question than a daily view can. The useful question is not which month was largest — it is what changed between them.
Ask your own data: Did my number of trades change between these months? Did my average risk per trade change? Did I apply the same entry rules throughout, or did my definitions quietly drift?
Weekday P&L — does your execution change with the calendar?
The journal stores a timestamp with every entry, so it can group your history by day of the week. This view surprises traders more often than any other, because weekday habits sit outside a broker statement entirely — and trading discipline usually breaks on the same days each time.
In the sample, Wednesday (₹17,460) and Monday (₹13,260) contribute more of the total than Tuesday (₹6,600) or Thursday (₹6,840). A weaker day is not automatically a market problem. It may reflect fewer qualified setups, more trades taken out of boredom, a recurring work commitment, or simply less sleep. The journal cannot tell you which — it tells you where to look.
Ask your own data: Am I taking a similar number of trades on every weekday? Are my weaker days weaker because of results, or because of what I chose to trade? Is anything outside the market repeating on those days?
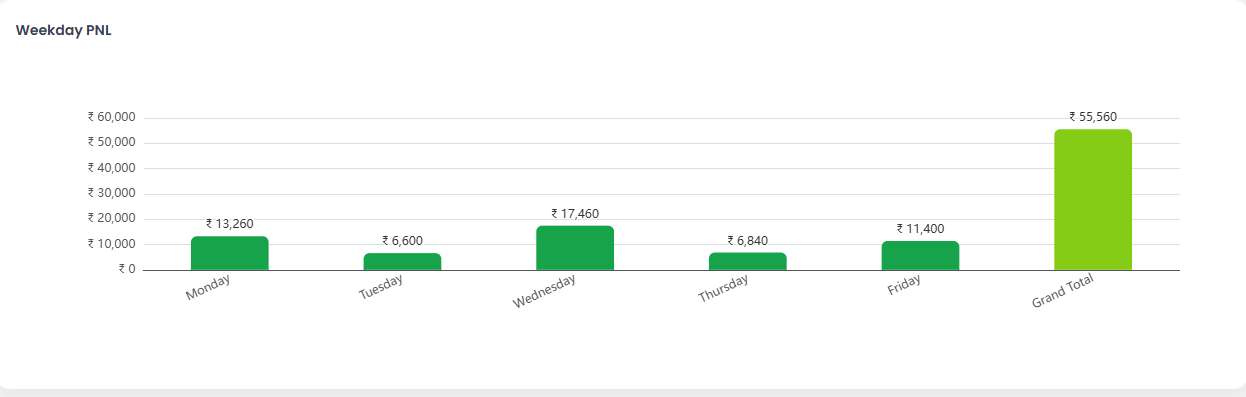
Weekday-wise historical P&L
Time-wise P&L — is every trading hour earning its place?
Grouping entries by trade time shows how your recorded activity spreads across the session. For a working professional, or anyone using a trading journal for beginners as a first review habit, this is often the most practical view in the whole tool.
The sample record concentrates in the opening hour, 09:15–10:15 (₹22,140), with 11:15–12:15 (₹18,000) also meaningful, while 12:15–13:15 contributed ₹1,200 over the same period. A thin hour is worth investigating rather than judging. It may contain very few trades, or many trades with small results — and those are completely different problems. Always check the trade count beside the total before concluding anything.
Ask your own data: How many trades actually sit inside my weakest hour? Am I trading that hour because a setup appeared, or because I happened to be at the screen? Do my planned-versus-actual differences cluster around particular times?
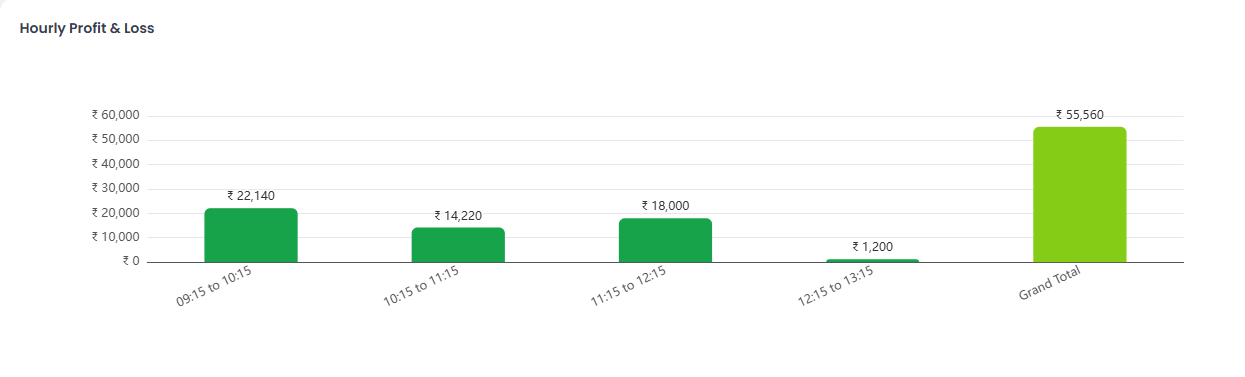
Time-wise (hourly) historical P&L
Strategy-wise P&L — which strategy do you actually execute well?
This is where the strategy field you filled in before entry pays for itself. Any trading journal in India can only group your history by strategy if you tagged each entry honestly at the time, which is why consistent field names matter far more than any dashboard.
The sample separates six tagged strategies. One carries no recorded result at all, and the rest vary widely. That spread raises a process question rather than a ranking: a tag with a small contribution may have been traded twice, or traded twenty times without following its rules.
Read these groupings carefully. They describe your execution of a strategy — not the strategy itself. Two traders using the same tag will produce entirely different histories.
Ask your own data: How many recorded trades sit behind each tag? Did I follow that strategy’s own entry and exit rules, or did I apply the label afterwards? Is one tag becoming a catch-all for trades that did not fit anywhere else?
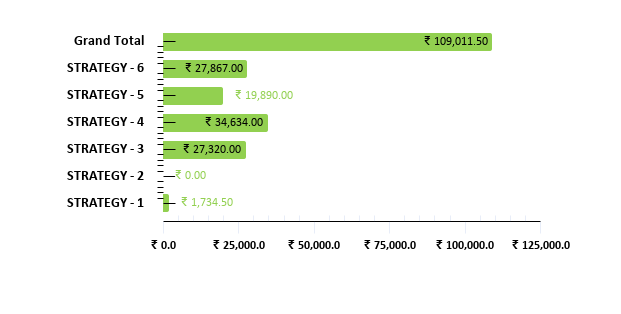
Strategy-wise historical P&L
Entry-reason P&L — does your stated reason match your record?
The entry-reason field asks you to commit, before the trade, to why you are taking it. Grouping your history by that field closes the loop on the single most useful habit in journaling: writing the reason down before you know the outcome. This is also where trading psychology stops being a theory and becomes something you can actually read back.
The sample groups records under Breakout Confirmation, Pullback Entry and Reversal Setup. A view like this shows whether the setups you believe you trade are the setups your records actually contain. It is also the view that exposes hindsight. If a large share of your entries carry a vague reason — or a reason added after the exit — every analytic above it loses most of its meaning.
Ask your own data: Which entry reason appears most often in my records? Do I have entries where the reason was really written after the exit? Is there a reason I use constantly but have never defined in writing?
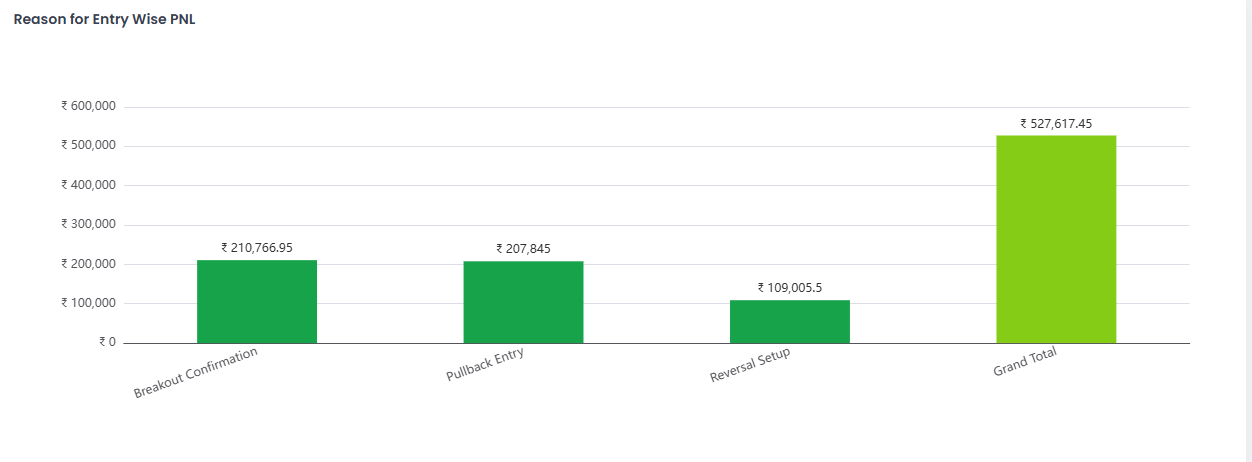
Entry-reason / setup-wise historical P&L
Illustrative screenshot from a sample user account. Figures shown are historical, user-recorded entries for demonstration only and do not indicate expected, typical or future results.
None of these views predicts your next trade. They reorganise records you already created so that patterns become visible enough to question. Each observation is a starting point for review, and historical observations do not guarantee future results.
| These six views are built from your own entries — nothing else.
Record your first ten trades in the FREE LogicIQ Trading Journal and the day-wise, weekday, hourly and strategy-wise views organise themselves. → CREATE YOUR FREE JOURNAL — NO COST |
Historical analytics organise personal records without predicting future outcomes.
10. Your Journal Can Mirror Trading Behaviour
Trading psychology becomes more useful when connected with recorded behaviour. Compare plan versus execution, planned entry versus actual entry, planned stop versus actual exit, planned target versus exit reason, and strategy rules versus actual execution.
Write observable states such as rushed, hesitant, bored, confident, or frustrated. Avoid diagnosing yourself through dramatic labels. Journaling may help identify repeated behavioural patterns, but it cannot eliminate emotions or guarantee disciplined decisions. Evidence creates questions that deserve calm review.
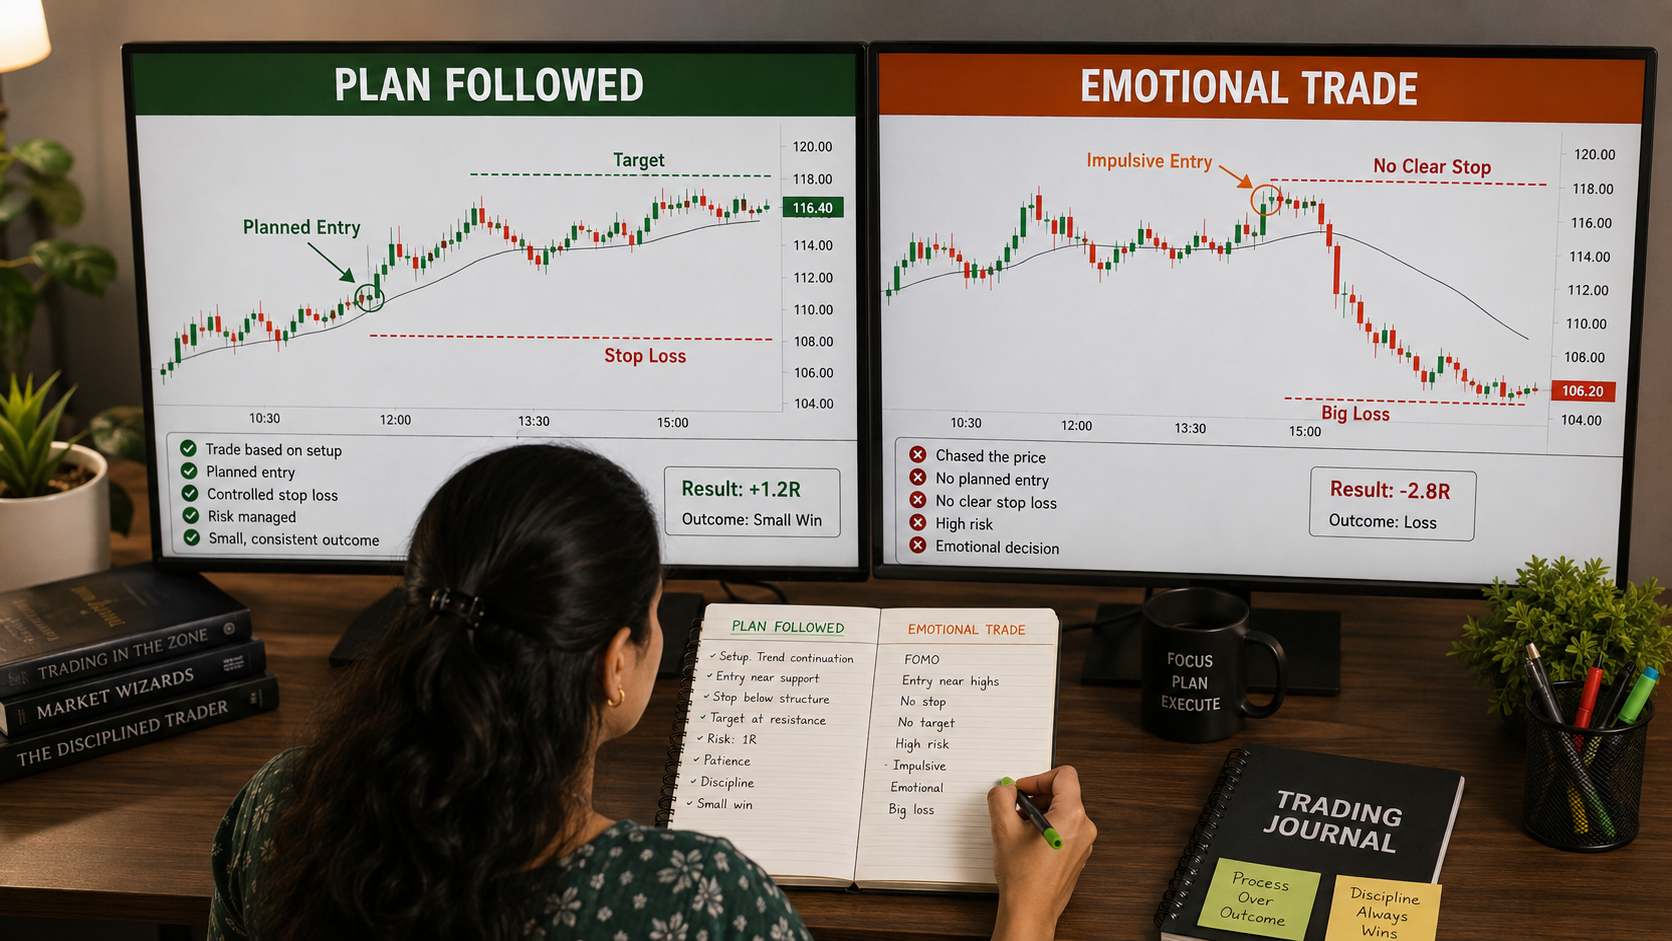
Review observable differences between the trading plan and actual execution.
11. Build a Weekly Review Routine
Choose a quiet time when live markets cannot distract you. Review screenshots, results, risks, emotions, rule scores, and management decisions. Group comparable setups instead of judging isolated wins and losses. Larger samples usually provide stronger evidence than several recent outcomes.
Calculate win rate, average gain, average loss, expectancy, and rule-following carefully. Net results should include reliable charges where practical. Finish by selecting one observable behaviour for improvement next week. Specific goals create clearer accountability than vague profit ambitions.
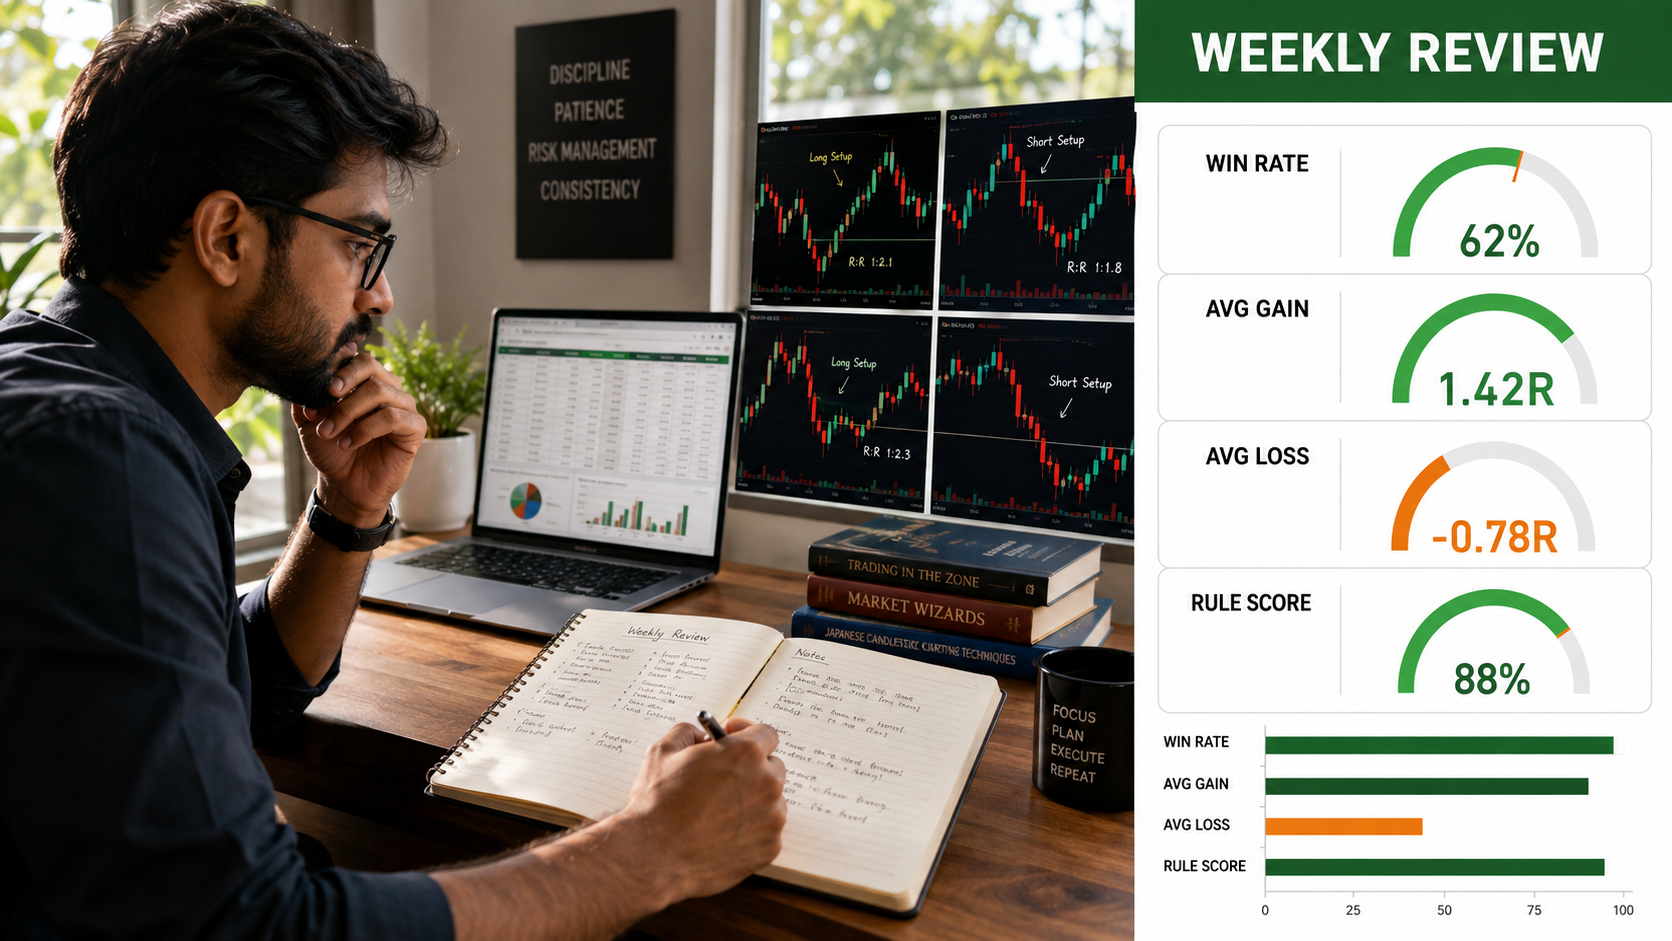
Weekly reviews convert individual records into structured personal feedback.
12. Learn Through Historical Educational Examples
The learning-oriented Trade Inside section can support concept exploration. A learner studying Box Theory may search the concept and explore relevant historical educational chart examples submitted by eligible members or mentors. Available examples may include supporting educational videos or URLs.
| Learning Flow LEARN CONCEPT → EXPLORE HISTORICAL CHART EXAMPLES → UNDERSTAND THE REASONING → PRACTICE OR PAPER TRADE → JOURNAL YOUR OBSERVATION → REVIEW |
These materials must never be presented as live calls or instructions to copy trades. The appropriate interface label is: Historical Educational Example — Not a Buy/Sell Recommendation. Every learner remains responsible for independent evaluation and risk awareness.
How to use a historical example without copying it
A historical example teaches nothing if it is read as a signal. Work through it in this order:
- Learn the concept first. Read the theory before you look at any chart.
- Cover the outcome. Examine only the part of the chart available before the entry shown.
- Write your own reading — where would your stop and target sit, and why?
- Then reveal the rest and compare your reasoning against the example’s.
- Paper trade the concept in current conditions, and journal every attempt.
- Review your own records — not the example’s.
Step six is the point of the whole sequence. The historical example is a teaching aid; your journal is the evidence. Market conditions, liquidity and volatility at the time of any historical example may differ from today, and no past example indicates what will happen next.
13. Common Trading Journal Mistakes
Common mistakes include recording only winning trades, completing entries much later, changing field definitions, ignoring costs, and collecting data without scheduled reviews. Another mistake is treating small samples as reliable predictions. Honest and timely records matter more than decorative complexity.
14. Start Building Your Trading Record — FREE
You do not need another promise of market accuracy. You need better evidence about your own trading process. The LogicIQ Trading Journal is offered as a FREE tool for documenting paper and actual trades, organising trading history, preserving chart evidence, and reviewing personal historical activity.
Begin with complete entries rather than complicated analysis. Record your plan, execution, result, chart, and lesson. Review comparable trades regularly and question recurring differences. The journal remains a self-review tool, while market outcomes always remain uncertain.
Your first week with the journal
Start narrow. Trying to record everything usually ends in recording nothing.
- Days 1–2: record every trade using only six fields — instrument, strategy, entry reason, stop-loss, exit reason, result.
- Days 3–5: add the TradingView chart link and one sentence of remarks per trade.
- End of week: sit down once, read your own entry reasons back, and pick a single observable behaviour to watch next week.
Complete entries beat clever analysis. Five honest records are worth more at review than fifty half-filled ones. Whether you treat it as a trading diary, a risk management journal, or a full trading performance review, the habit is the same: write the plan before the trade, and read it back afterwards.
| RECORD. REVIEW. ANALYSE. LEARN. [START YOUR FREE TRADING JOURNAL] |
15. Frequently Asked Questions
What is a trading journal?
It is a structured record of plans, executions, outcomes, chart evidence, emotions, and lessons. It supports historical self-review rather than market prediction.
Is the LogicIQ Trading Journal free?
The tool is positioned as a FREE self-journaling resource. Publication teams should confirm the final access link and current availability before publishing.
Can beginners use a trading journal?
Yes. Beginners can start with paper trades and simple fields. Regular reviews may reveal unclear rules before those behaviours become repeated.
Does the journal provide trading calls?
No. It supports record keeping, historical analytics, education, and self-review. It does not provide live buy or sell calls.
Can it record options trades?
Where applicable, records can include expiry, call or put, strike, direction, price, quantity, timing, strategy, risk, and exit details.
Why save a TradingView chart URL?
The link preserves chart context beside written reasoning. Later reviews can compare the original plan with subsequent movement and actual execution.
Why separate paper and actual trades?
Separate filters help compare simulated planning with actual execution. Differences provide evidence for investigation, not automatic psychological conclusions.
Which analytics can be reviewed?
Historical summaries may include counts, percentages, P&L periods, strategies, setups, days, times, risk-reward observations, and trade status.
Can a trading journal guarantee profitability?
No. Journaling cannot guarantee profits, accuracy, discipline, or future results. It only organises personal records for educational review.
How often should records be reviewed?
Complete entries promptly and schedule broader weekly reviews. Monthly reviews can examine larger comparable samples.
16. Compliance Disclaimer
Disclaimer: This content is intended solely for educational and general market-awareness purposes and should not be construed as investment advice, a recommendation, research report, or solicitation to buy or sell any security. The LogicIQ Trading Journal is a record-keeping, analytics and educational self-review tool. Analytics are based on information recorded by users and historical journal data and do not predict or guarantee future performance. Securities-market investments and trading are subject to market risk, including possible loss of capital. Users should independently evaluate their decisions and, where appropriate, consult a SEBI-registered professional.
Compliance review flag: Confirm the current product name, FREE access terms, CTA destination, feature availability, strategy labels, mentor-example eligibility, privacy wording, and final screenshots before publication.
Official and Research Sources Consulted
SEBI Investor: Securities-market investing dos and don’ts — https://investor.sebi.gov.in/securities-dos_and_donts.html
Fenton-O’Creevy and colleagues: emotions and trader decision-making — https://doi.org/10.1002/job.720