Budh Gochar and Nifty What the Video Actually Examines
Financial astrology videos planetary dates ko market behaviour ke saath compare karte hain. Lekin responsible learning ke liye observation aur prediction ka difference samajhna zaroori hai. Yeh article Smart Astrology ke Budh Gochar video ko simple Hindi-English mein explain karta hai. Video mein diye gaye views aur study Smart Astrology ki apni hai. LogicIQ Pro Academy in views se sambaddh nahi hai aur inka samarthan (endorsement) nahi karta. Hum dates, chart examples, aur timing windows ko carefully review karenge. Planetary movement ko proven market cause nahi maana gaya hai.
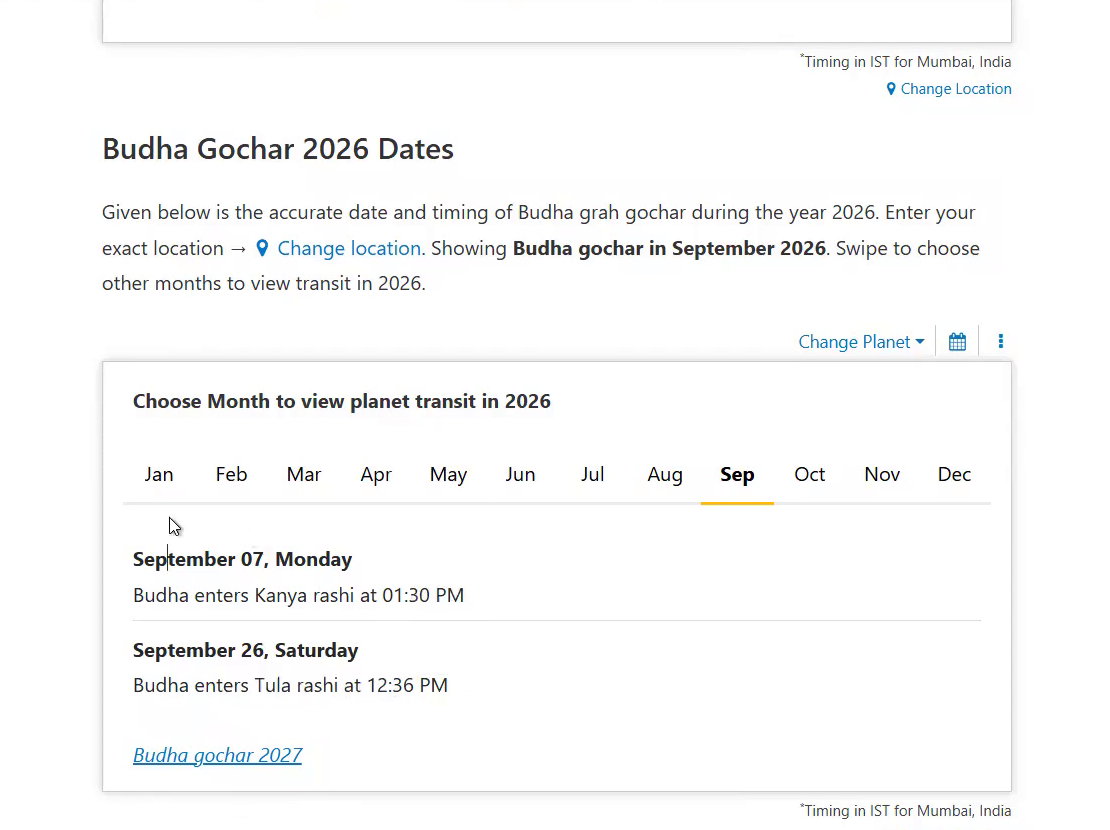
Video 26 September 2026 ko upload hua tha. Ismein Mercury ke Tula Rashi mein enter karne ki discussion hai. Independent astrology calendars bhi transit date 26 September batate hain. Exact clock time sources ke beech thoda different milta hai. Isliye yahan date ko minute-level precision se zyada importance di gayi hai.
Transcript mein ek factual correction bhi zaroori hai. Video 27 September 2026 ko Monday batata hai. Calendar verification ke mutabik woh date Sunday thi. Agla regular weekday session Monday, 28 September 2026 tha, exchange calendar ke subject mein. Yeh correction wrong session candle par analysis banne se bachata hai.
Quick Answer
Video selected Mercury transit dates ko nearby Nifty candles ke saath compare karta hai. Ismein possible turning zones, candle-range breaks, aur three intraday timings dikhaye gaye hain. Yeh speaker ke historical observations hain, confirmed market rules nahi. Learners ko price, volume, volatility, aur broader context ke against testing karni chahiye. Koi transit date direction ya returns guarantee nahi karti.
Watch the Original Video
1. What Budh Gochar Means in This Video
Gochar ka matlab ek planet ka ek zodiac sign se doosre sign mein jaana hai. Is video mein Budh, yani Mercury, Kanya se Tula mein move karta hai. Speaker in dates ko Nifty observation points ke roop mein dekhta hai. Yeh astrological interpretation hai, exchange-defined market event nahi. NSE prices orders, liquidity, information, aur risk appetite se banti hain.
Video September ki do dates mention karta hai: 7 September aur 26 September. Speaker ke calendar mein pehli date Mercury ka Kanya mein entry dikhati hai. Doosri date Mercury ka Tula entry point hai. Video phir nearby Nifty candles ko backward review karta hai. Iska purpose pattern study hai, statistical proof nahi.
2. Why the Date Correction Matters
Kisi bhi event ko analyse karne se pehle market calendar check karna chahiye. Indian equity trading normally Monday se Friday hoti hai, declared holidays ko chhodkar. Transcript kehta hai market Monday, 27 September ko khulega. Lekin 27 September 2026 Sunday tha, isliye yeh statement incorrect hai. Monday ki actual date 28 September 2026 thi.
Yeh difference important hai, kyunki daily candles specific sessions se belong karti hain. Wrong candle ke saath event jodne par conclusion distort ho sakta hai. Responsible analyst transit time, timezone, next tradable session, aur selected candle record karega. Same rule holidays, weekend events, aur after-market announcements par bhi apply hota hai.
3. Historical Dates Reviewed in the Video
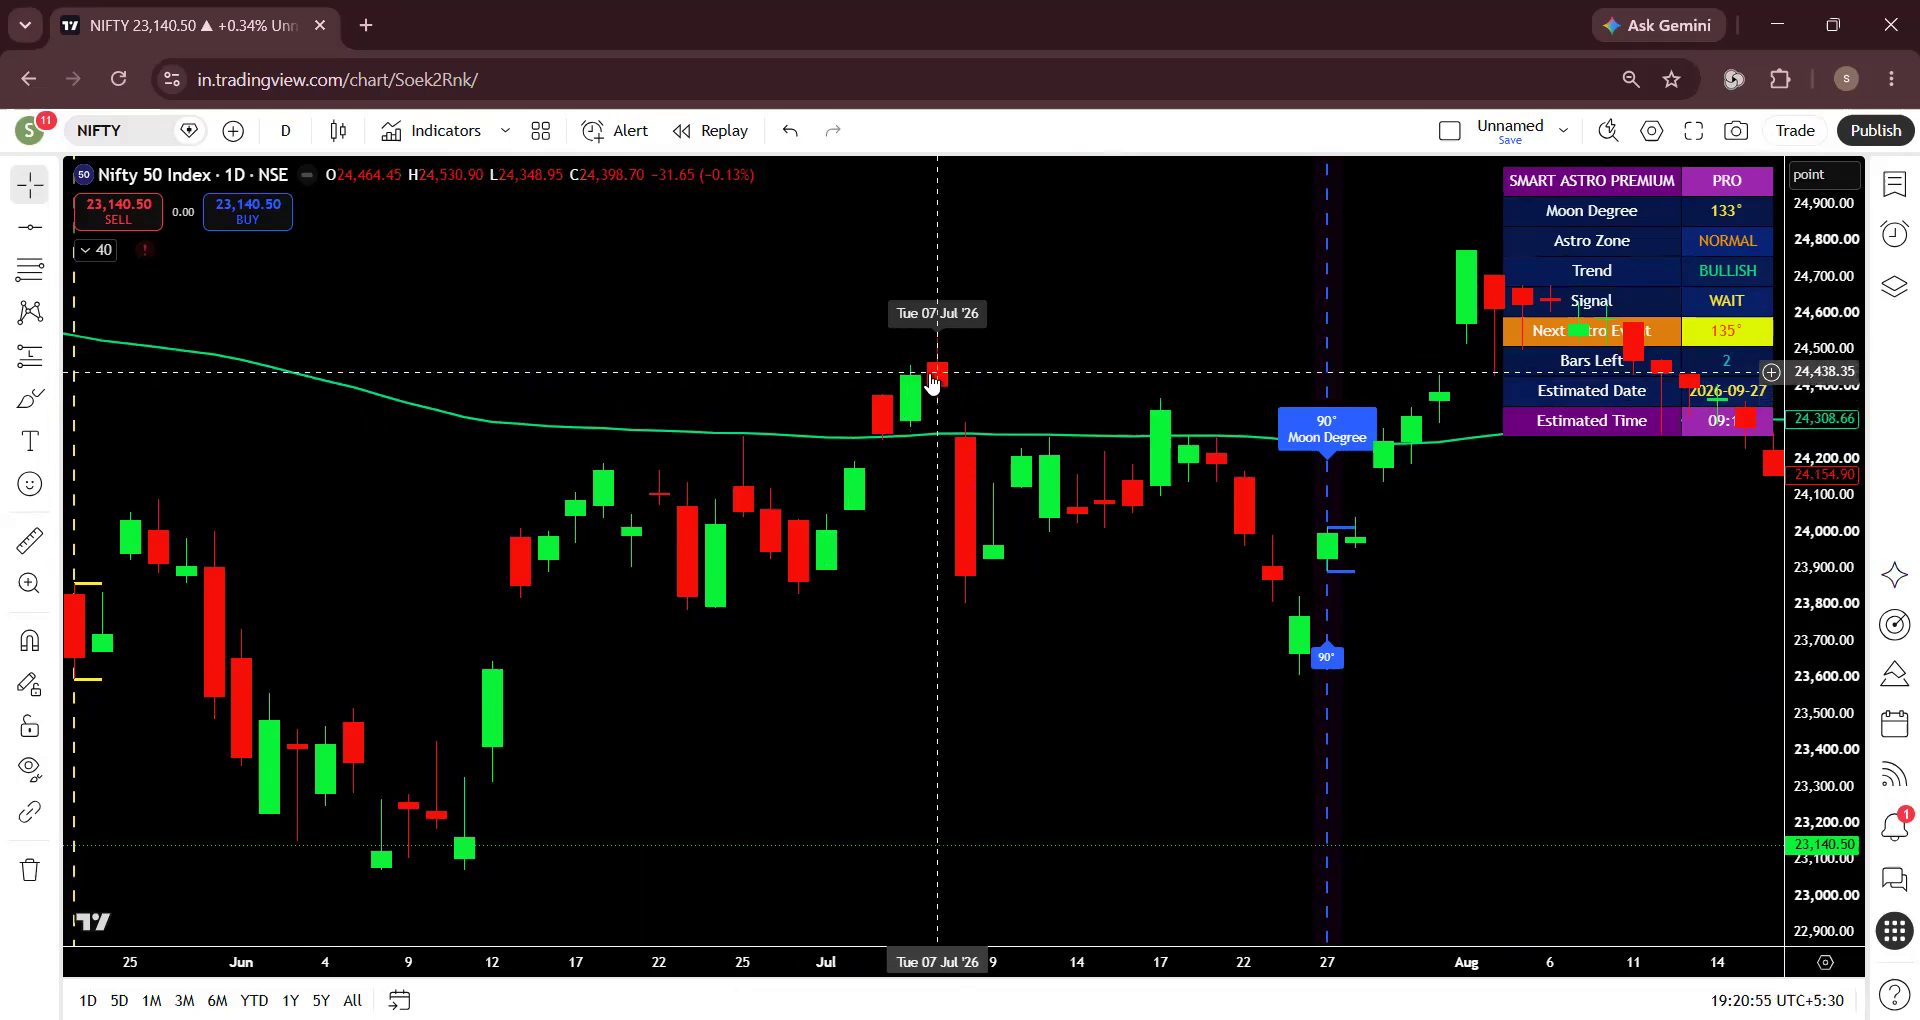
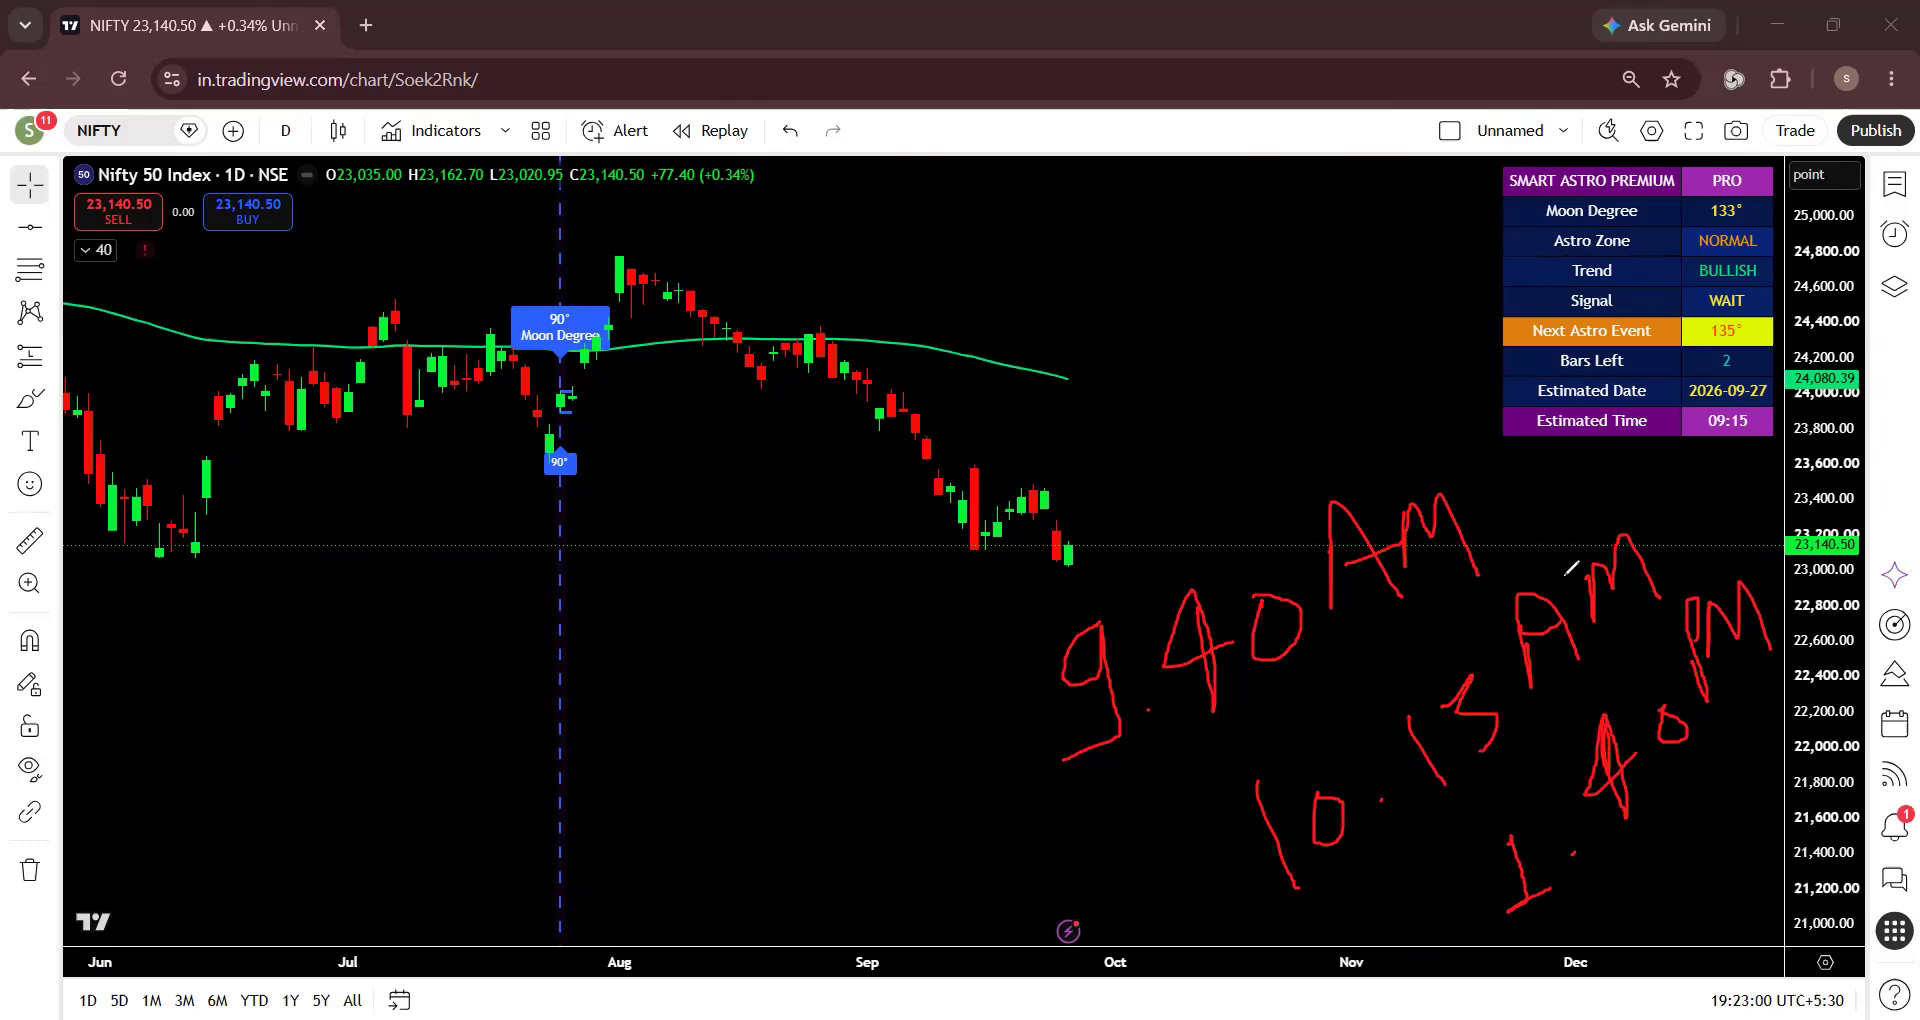
Speaker Mercury sign changes ke aas-paas several earlier dates review karta hai. Inmein 5 August, 22 August, 7 September, 7 July, aur 24 July shamil hain. Charts nearby pauses, declines, reversals, ya directional moves dikhate hain. Examples visually interesting hain, lekin selected cases dependable forecasting relationship establish nahi karte.
| Date discussed | Video’s chart observation | Responsible interpretation |
|---|---|---|
| 7 September 2026 | Weakness paused before a stronger move appeared. | A nearby move is visible; causation remains unproven. |
| 22 August 2026 | Price became sideways before breaking lower. | Check the next tradable session and exact candle data. |
| 5 August 2026 | Price appeared near a local top before declining. | Local tops are easier to identify retrospectively. |
| 24 July 2026 | Price appeared near a lower zone before reversing. | Define the reversal rule before reviewing results. |
| 7 July 2026 | Price appeared near a local top. | One chart example cannot validate a recurring effect. |
Better review mein multiple years ke every Mercury sign change ko examine karna hoga. Har event par same measurement rules apply hone chahiye. Pre-event trend, next session, gap, range, volume, aur forward returns record karein. Losing aur neutral examples bhi dataset mein rehne chahiye. Warna selection bias weak pattern ko convincing bana sakta hai.
4. Candle High and Low as a Neutral Framework
Video next session candle ka high aur low observe karne ka framework deta hai. Isse ek simple reference range milti hai. Range ke upar price higher-level acceptance show kar sakta hai. Range ke neeche price lower-level acceptance dikha sakta hai. Dono conditions automatically continuation, profitability, ya safe entry predict nahi karti.
Range breaks fail bhi ho sakte hain, kyunki market often dono sides test karta hai. Opening gap price ko immediately reference ke outside rakh sakta hai. Isliye closing confirmation, volume, volatility, aur market breadth examine karein. False breaks ko ignore karne ke bajay record karein. Tab attractive chart idea ek measurable study banega.
5. The Video’s Three Day Movement Claim
Speaker suggest karta hai ki stronger movement roughly three days continue kar sakti hai. Is claim ko sirf testable hypothesis maana chahiye. Transcript complete dataset, calculation method, ya success rate provide nahi karta. Significant movement ki numerical definition bhi absent hai. In definitions ke bina objective verification possible nahi hota.
Practical research sheet one-day aur three-day returns measure kar sakti hai. Maximum favourable aur adverse movement bhi capture hona chahiye. Figures ko ordinary non-event sessions se compare karein. Similar behaviour milne par transit limited extra information deta hai. Large samples mein difference persist ho, tab further investigation useful ho sakti hai.
6. Intraday Times Mentioned by the Speaker
Video teen specific intraday times identify karta hai, jo sirf 28 September 2026 ke beet chuke session ke liye bataye gaye the. Hum unhe yahan repeat nahi karte, kyunki timings ke saath yeh trade call jaisa lag sakta hai. Yeh timings video-specific aur date-specific thi. Har trading day ke permanent turning points nahi hain. Fresh testing ke bina inhe current trade calls ke roop mein reuse nahi karna chahiye.
Intraday study mein each timestamp ke around fixed window define karein. Window se pehle trend direction aur baad ki volatility record karein. Genuine reversal ki objective definition testing se pehle decide honi chahiye. Warna session ke baad almost any small fluctuation ko successful label kiya ja sakta hai.
7. Financial Astrology and Technical Confirmation
Financial astrology ko event-tagging framework ki tarah study kiya ja sakta hai. Yeh learner ko careful observation dates suggest kar sakta hai. Technical confirmation ke liye independent market evidence phir bhi zaroori hai. Price structure, volume, breadth, volatility, gaps, aur major news useful checks hain. Yeh directly market behaviour describe karte hain, planetary causation assume nahi karte.
Maan lijiye astrological date recent resistance zone ke near aati hai. Yeh overlap closer study justify kar sakta hai, recommendation nahi. Market upward break, rejection, ya sideways movement dikha sakta hai. Disciplined journal teeno possibilities record karta hai. Result visible hone se pehle rule bhi record hona chahiye.
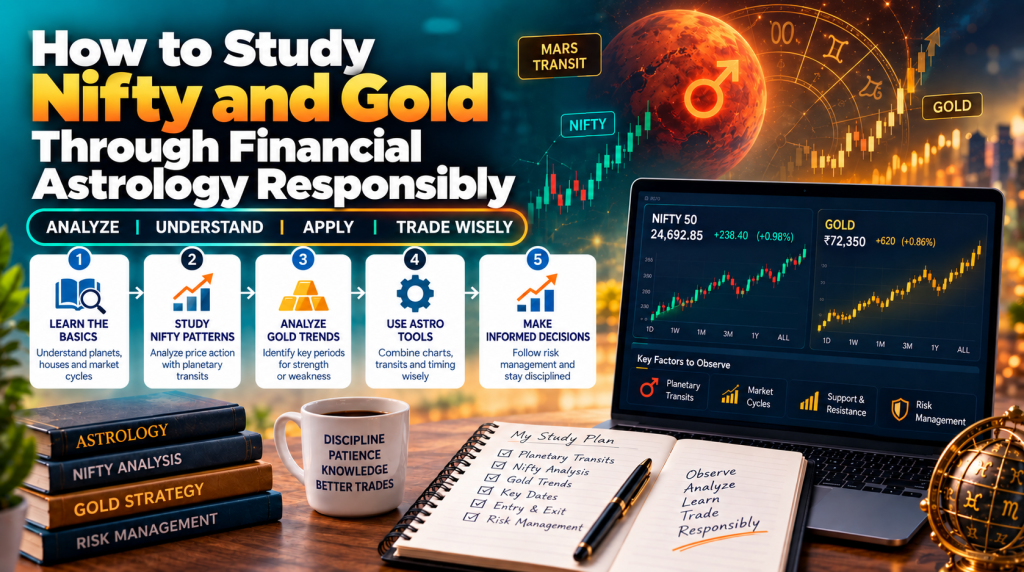
Related LogicIQ learning: How to Study Nifty and Gold Through Financial Astrology Responsibly and Rahu and Ketu in 12 Houses for Traders
8. A Responsible Validation Process
Kisi visual relationship ko accept karne se pehle repeatable process use karein. Pehle complete event list freeze karein. Phir unadjusted event dates aur correct trading sessions collect karein. Charts kholne se pehle every measurement define hona chahiye. Favourable, unfavourable, aur neutral outcomes saath publish karein. Isse hindsight bias kam aur transparency better hoti hai.
- Record the transit date, exact time, timezone, and source.
- Map weekend events to the next valid exchange session.
- Define the reference candle and breakout rule beforehand.
- Measure gaps, range, volume, volatility, and forward returns.
- Include failed breaks, sideways sessions, and opposite outcomes.
- Compare event results with ordinary control-period sessions.
- Keep astrology observations separate from trading decisions.
Trading journal is process ko easier banata hai. Market move se pehle kya expected tha, woh preserve hota hai. Screenshots mein timestamp aur instrument details hone chahiye. Notes batayein observation astrological, technical, ya macroeconomic tha. Yeh separation ek successful example ko unsupported general rule banne se rokta hai.
9. Common Mistakes to Avoid
- Treating a nearby move as proof that the transit caused it.
- Checking only examples that support the original expectation.
- Using weekend dates without mapping the next trading session.
- Changing breakout or reversal definitions after seeing results.
- Ignoring news, gaps, liquidity, volatility, and broader sentiment.
- Turning educational timing windows into personalised trade calls.
Ek aur common mistake overly certain language use karna hai. ‘Market will reverse’ jaisi line actionable certainty create karti hai. Responsible wording kahegi ki video possible observation window identify karta hai. Aisi language uncertainty ko respect karti hai aur readers ko independently sochne deti hai. Yeh LogicIQ ke educational purpose se bhi align hoti hai.
10. What Indian Learners Should Monitor Instead
Indian market learners ko event study ke saath verified context combine karna chahiye. Official NSE calendar, normal session timings, aur relevant disclosures check karein. Index breadth, sector behaviour, volatility, aur institutional flows carefully observe karein. Broader context bhi direction guarantee nahi karta. Lekin yeh market conditions ki more complete explanation deta hai.
For an example of fact-based daily context, read the LogicIQ Morning Outlook. It shows how multiple drivers can be separated from directional certainty.
11. Correlation Is Not the Same as Causation
Do events close together hon, toh correlation dikh sakta hai; causation prove nahi hoti. Mercury transit ke near Nifty reversal earnings, policy news, global risk, option positioning, ya institutional activity reflect kar sakta hai. Market prices many influences simultaneously absorb karti hain. Isliye chart ko nearby observation batayein, Mercury-created move ka evidence nahi.
Hand-picked dates mein yeh distinction aur important ban jata hai. Analyst pehle large move dekhe, phir astrological event search kare, toh hindsight bias aata hai. Strong method complete transit list se start hota hai. Every corresponding session identical rules se measure hota hai. Measurement framework final hone tak results hidden rehne chahiye.
Control periods study ko improve karte hain. Aise ordinary sessions choose karein jahan selected transit event na ho. Unka average range, gap, volatility, aur forward movement event sessions se compare karein. Dono groups similar hon, toh astrology label measurable value add nahi karta. Difference milne par bhi larger samples aur repeated testing zaroori hai.
12. Building a Clean Observation Journal
Clean journal expectation ko outcome se separate karta hai. Session se pehle event date aur exact hypothesis record karein. Hypothesis unusually wide movement ke baare mein ho sakti hai, direction ke baare mein nahi. Session ke baad result chahe jo ho, same measurements capture karein. Isse journal sirf successful screenshots ka collection nahi banega.
Every entry mein instrument, timeframe, data source, aur session date include honi chahiye. Event trading hours, closing ke baad, ya weekend par hua, yeh note karein. Major scheduled news aur unusual gaps separately record karein. Yeh fields alternative causes explain karte hain. Screenshots written data ko support karein, replace nahi.
Monthly review mein hits, misses, aur neutral outcomes count karein. ‘Hit’ ki fixed numerical definition pehle decide honi chahiye. Baad mein definition change karne se percentage unreliable ho jata hai. Trading-related hypothesis evaluate karte waqt transaction costs, slippage, aur execution limits consider karein. Visually impressive move bhi practical repeatable edge provide nahi kar sakta.
13. How to Read the Video Without Turning It into a Signal
Safest approach video ko guided chart-reading exercise ki tarah use karna hai. Observe karein speaker dates, candles, aur timing windows ke beech kaise move karta hai. Phir poochhein kaunsa evidence each claim confirm ya reject karega. Isse passive watching structured learning mein change hoti hai. Assumptions samjhe bina conclusion copy karne ka temptation bhi kam hota hai.
Mentioned timings ko automatically future sessions mein carry mat karein. Har Mercury transit top ya bottom banayega, yeh assume nahi karein. Research question create karke patiently evidence collect karein. Testing mein relationship disappear ho, toh woh outcome bhi valuable hai. Good analysis truth discover karta hai, preferred belief protect nahi.
Frequently Asked Questions
Kya Budh Gochar Nifty reversal guarantee karta hai?
Nahi. Video historical observations present karta hai, proven causal rule nahi. Market direction uncertain rehti hai aur many interacting factors par depend karti hai.
Kya 27 September 2026 Monday tha?
Nahi. Woh Sunday tha. Next regular weekday session Monday, 28 September 2026 tha, official exchange calendar ke subject mein.
Kya three intraday timings daily use ho sakti hain?
Nahi. Video ne unhe specific session ke liye present kiya tha. Independent testing zaroori hai; inhe permanent signals nahi maana chahiye.
Reference candle breakout ka meaning kya hai?
Iska matlab price selected candle ke high ya low ke beyond move kare. Aisa movement fail ho sakta hai aur continuation guarantee nahi karta.
Financial astrology responsibly kaise test karein?
Predefined rules, complete event samples, control periods, aur honest journaling use karein. Har failed aur neutral result review mein rakhein.
Kya yeh article investment ya trading advice hai?
Nahi. Yeh supplied video ko education ke liye explain karta hai. Koi security, position, entry, exit, target, ya stop-loss recommend nahi karta.
Conclusion
Video financial astrology ko observational framework ke roop mein samjhata hai. Yeh Mercury transit dates ko selected Nifty candles aur intraday windows se connect karta hai. Charts further study support kar sakte hain, causation prove nahi. Reliable learning ke liye correct calendars, fixed definitions, complete samples, aur transparent results zaroori hain.
Most important correction session date se related hai. Sunday, 27 September 2026 Monday nahi tha. Next-session analysis Monday, 28 September se start hona chahiye. Is correction ke baad bhi every claim hypothesis hi rahega. Discipline, evidence, aur risk awareness learning process guide karein.
Continue Learning with LogicIQ Pro Academy
LogicIQ Pro Academy structured market education aur analytical learning par focus karta hai. Readers chart study, risk awareness, market structure, aur systematic journaling explore kar sakte hain. Har tool ko learning aid ki tarah use karein, assurance ki tarah nahi. Independent verification every market-related decision process ka part rehna chahiye.
| Important Educational Disclaimer
LogicIQ Pro Academy ek educational institution hai. Yeh SEBI ke saath Research Analyst, Investment Adviser, Portfolio Manager, ya kisi other regulated capacity mein registered nahi hai. SEBI ne is article, academy, tools, courses, webinars, ya services ko approve ya endorse nahi kiya hai. Yeh content strictly educational and informational purposes ke liye hai. Yeh investment advice, personalised financial guidance, recommendation, ya trade solicitation nahi hai. Market participation mein capital loss ka risk hota hai. Historical charts, backtests, astrology observations, indicator readings, aur past performance future results guarantee nahi karte. Readers independent research karein aur financial decisions se pehle SEBI-registered Investment Adviser ya Research Analyst se consult karein. Yahan discussed planetary relationships observational hypotheses hain, established market causes nahi. Video ke views aur study uske creator ki apni hai; LogicIQ Pro Academy in views se sambaddh nahi hai aur inka samarthan (endorsement) nahi karta. Is article mein sirf Nifty index ka historical spot data discuss hua hai; kisi stock, future ya option ka price data use nahi hua. LogicIQ Pro Academy reader accounts manage nahi karta aur individual trading decisions ki responsibility accept nahi karta. Complete policy: LogicIQ Legal Disclaimer and SEBI Compliance |