Can One Planetary Transit Explain a Market Move?
Market mein sudden gap, strong candle, ya sharp reversal dikhe, toh traders immediately notice karte hain. Naturally, they want to understand what caused that movement. Some examine news, global cues, liquidity, derivatives positioning, or technical structure. Financial astrology adds planetary transits and specific timing observations.
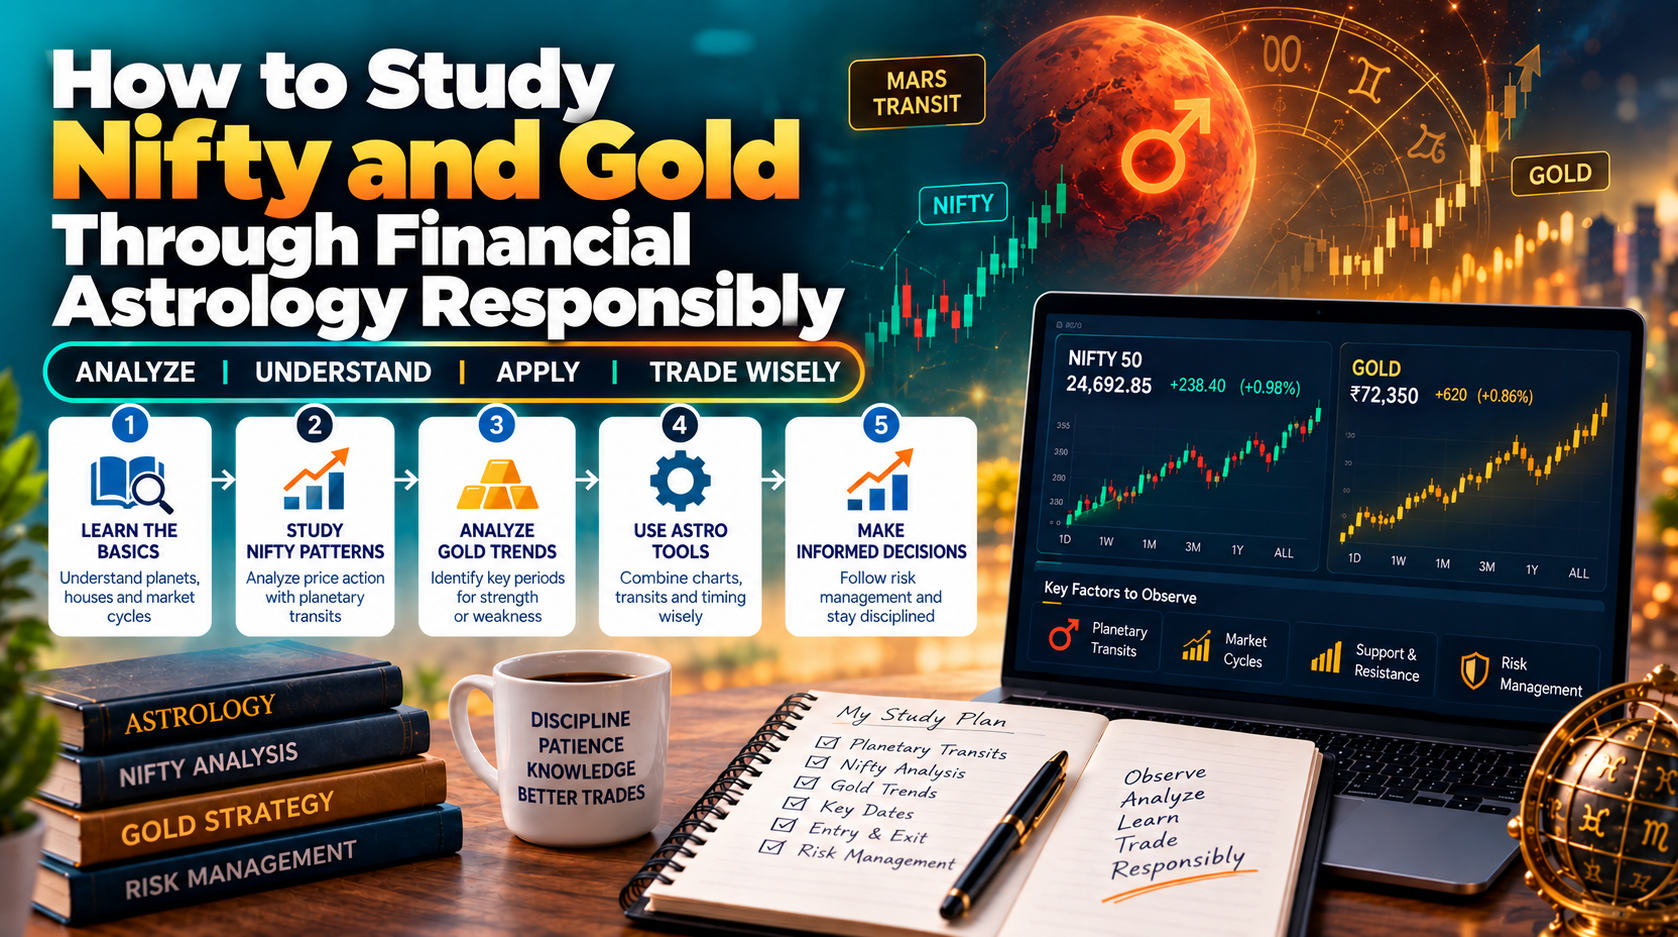
The video studies Mars moving from Gemini into Cancer. It also examines earlier Nifty gaps and gold consolidation periods. Lekin historical examples guaranteed cause-and-effect relationship prove nahi karte. Treat them as research questions, not automatic trading signals. The views and study presented in the video belong to Sanjay Kumar, founder of Smart Astrology. He also writes for LogicIQ Pro Academy, but LogicIQ Pro Academy is not affiliated with the views expressed in the video and does not endorse them.
1. What Is Financial Astrology?
Financial astrology asks whether celestial cycles coincide with recurring market behaviour. Practitioners track planetary ingresses, conjunctions, retrogrades, and intraday timings. Phir un dates ko historical market charts ke saath compare kiya jaata hai. The purpose should remain observation and testing, not blind prediction.
Astrological calendars can differ across systems, locations, and calculation methods. The video follows a Vedic framework dated September 18, 2026. Other calendars may show different dates because their conventions differ. Isliye exact source aur timezone record karna bahut zaroori hai.
2. Why Mars Transit Receives Market Attention
Vedic astrology associates Mars with energy, aggression, action, metals, and momentum. Cancer is traditionally considered a difficult placement for Mars. Video ke according, gaps or larger moves may appear around this change. It also discusses Jupiter and the Mars-Jupiter conjunction within that framework.
These interpretations belong to astrology, not established financial science. A transit date alone cannot explain order flow or market direction. Economic data, currencies, institutions, global markets, and news also influence prices. Responsible analysis mein these factors ko ignore nahi karna chahiye.
3. Gap Up and Gap Down Around Event Dates
The video compares selected Mars transit dates with later market openings. June 20, 2026 and August 2, 2026 occurred during weekends. Therefore, the following Monday sessions were examined on historical charts. May 11, 2026 was presented separately as a historical gap-down example.
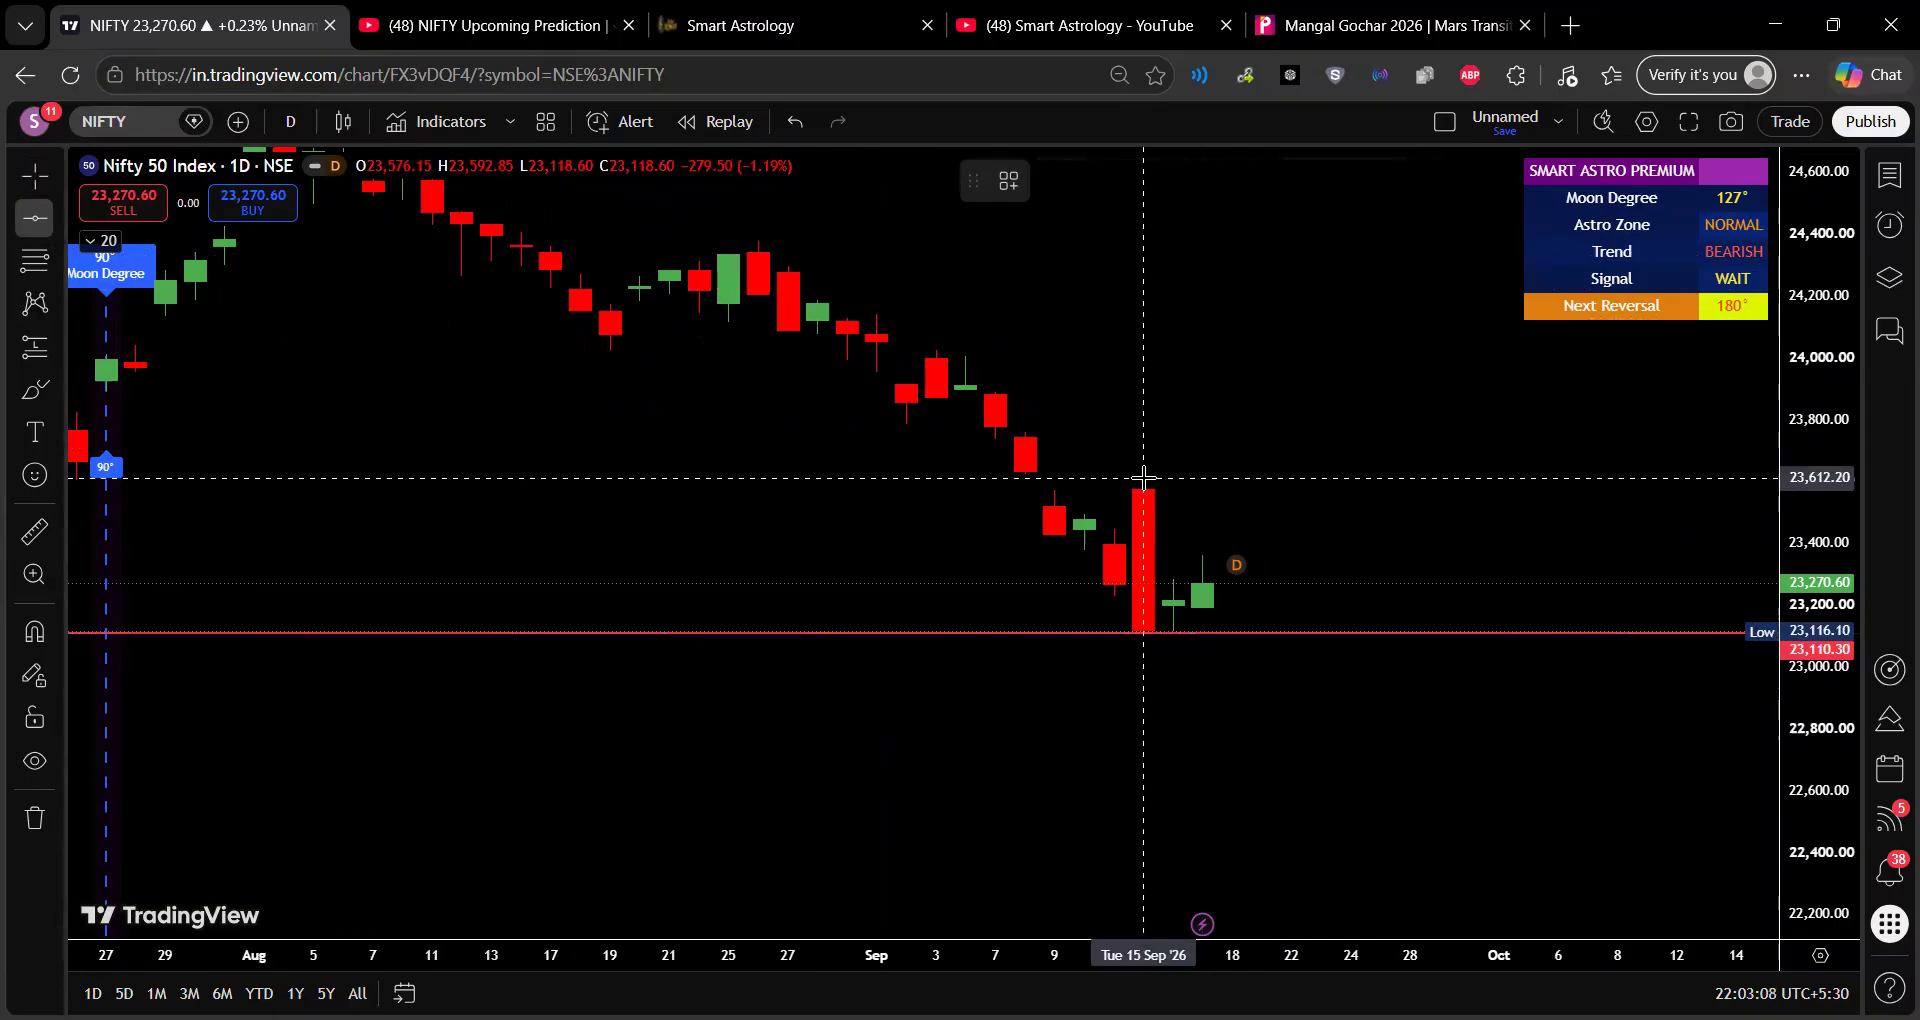
Simple language mein, a gap occurs away from the previous close. Overnight news, global indices, currencies, commodities, and pending orders can create gaps. Isliye a transit-date gap does not prove planetary causation. These examples should be treated only as historical case studies.
| Research Step | Responsible Method | Common Error |
| Choose events | List every qualifying transit before viewing charts | Selecting only memorable successful dates |
| Define a gap | Set one consistent percentage or point threshold | Changing definitions after seeing results |
| Use comparison days | Compare transit and non-transit sessions | Ignoring the normal frequency of gaps |
| Record context | Note news, global markets, holidays, and volatility | Attributing every move to one factor |
| Review results | Include hits, misses, and ambiguous examples | Showing only supportive screenshots |
For weekend events, examine the next available trading session. Exchange holidays should also be verified before comparing dates. Har example mein previous close aur new opening consistently record kijiye. Only then can different event dates receive a fair comparison.
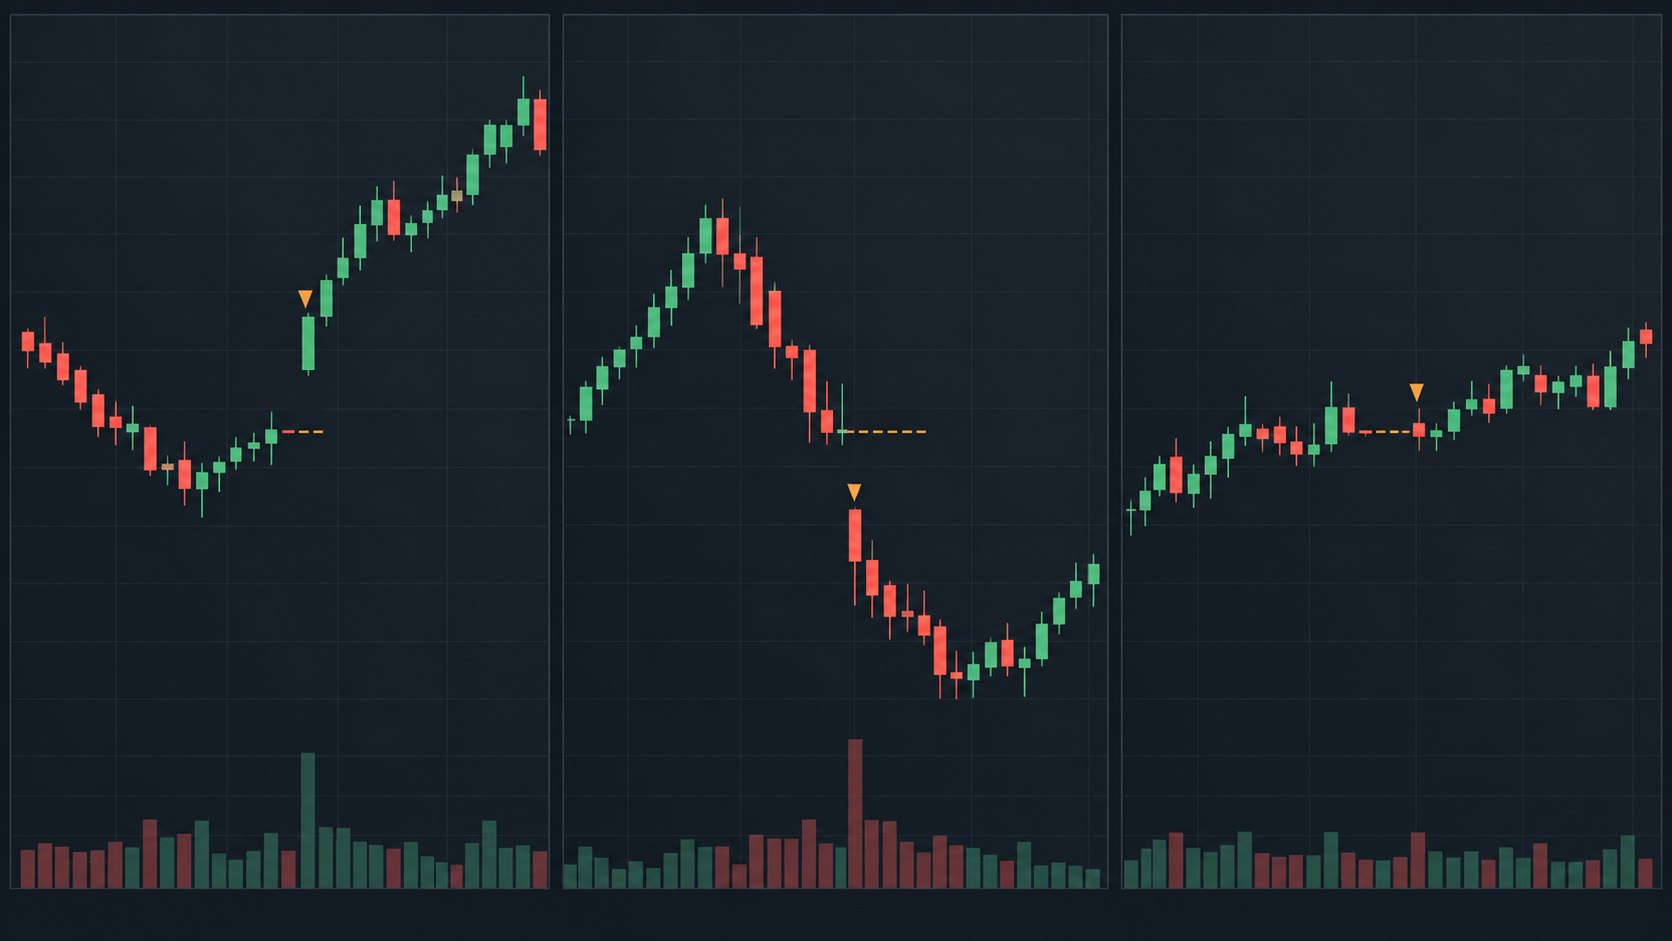
4. Does a Large Candle Always Retrace Fifty Percent?
The transcript discusses whether large candles revisit approximately half their range. Traders often mark the candle midpoint as a simple reference. Lekin fifty-percent recovery koi fixed market rule nahi hai. Some candles retrace deeply, while others continue without meaningful pullbacks.
Treating the midpoint as a testable level is more responsible. Record candle size, trend, volume, volatility, news, and later movement. Then measure midpoint touches during one clearly defined period. Rule pehle define nahi hoga, toh backtest misleading ho sakta hai.
5. Gold Consolidation and the Search for a Trigger
The video shows gold trading inside a range before the discussed transit. Consolidation generally reflects temporary balance between buyers and sellers. A later breakout remains possible, but direction requires price confirmation. Astrology may suggest timing, but it cannot guarantee direction.
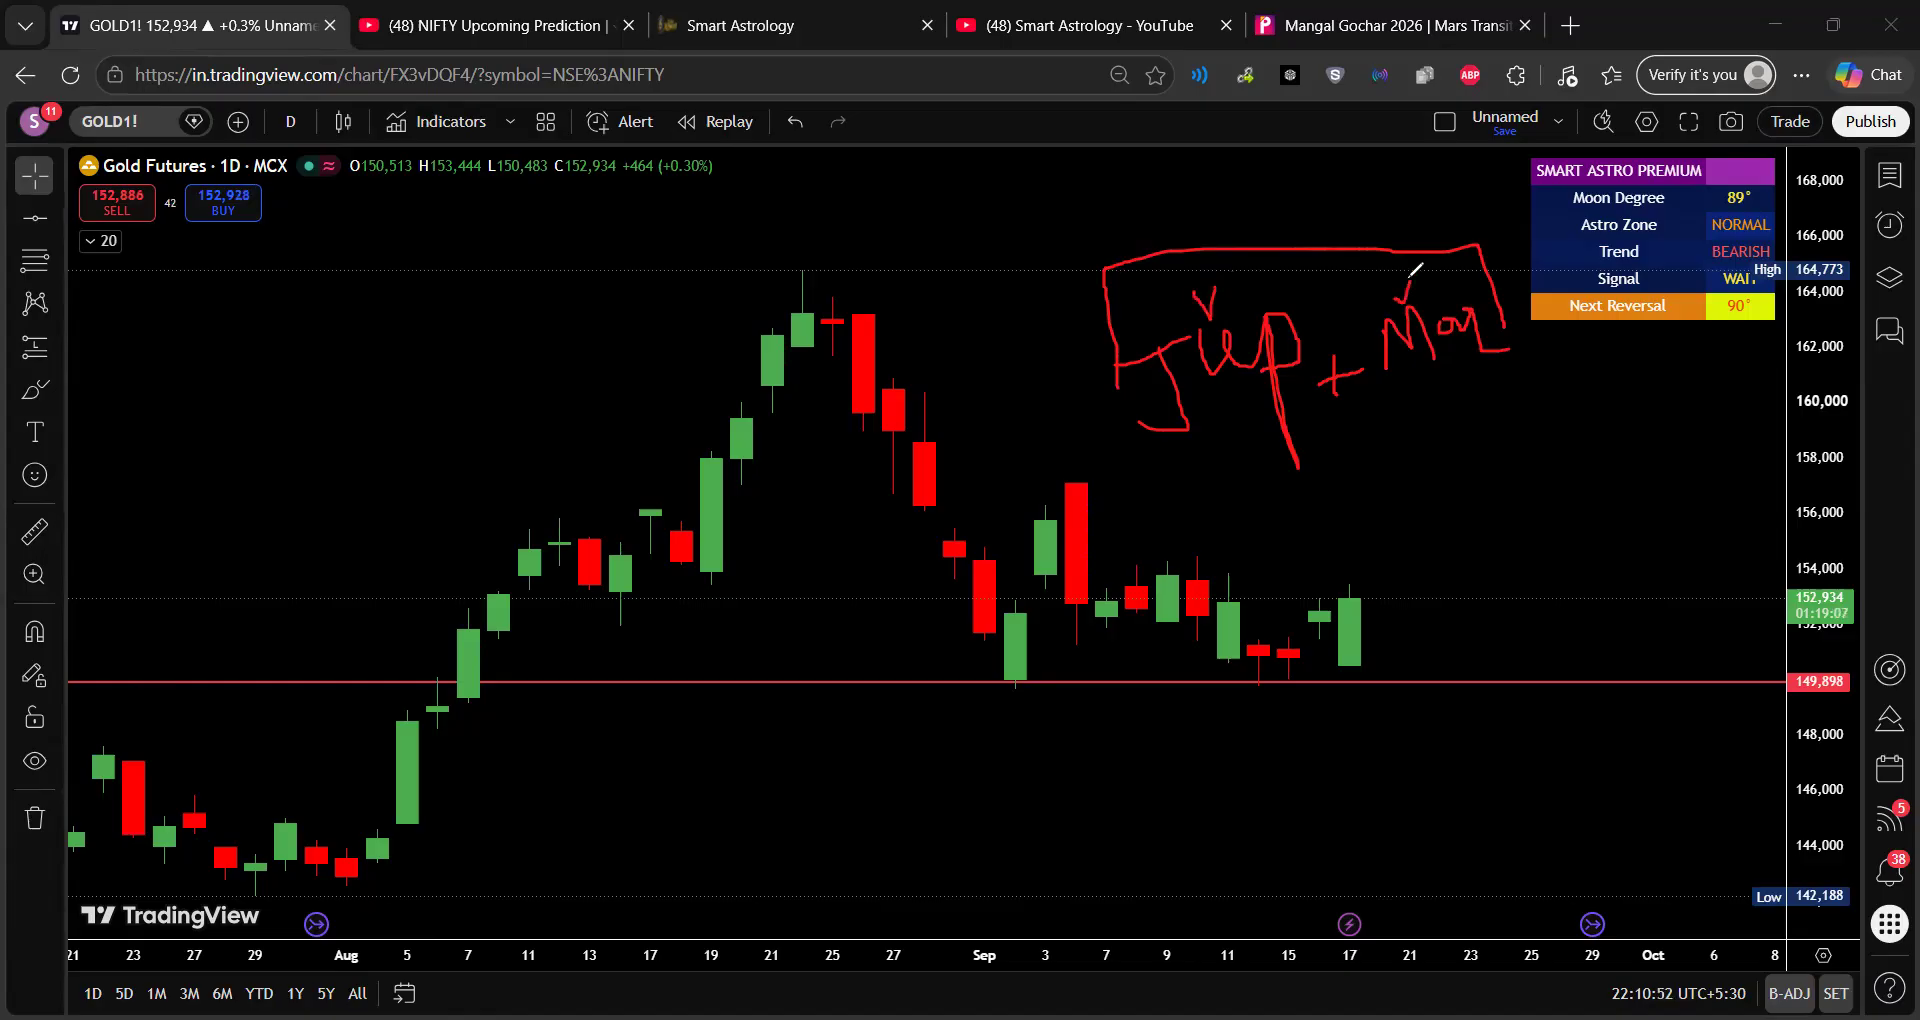
Gold also reacts to the US dollar, interest rates, inflation, geopolitical risk, and central-bank demand. Astrological observations ke saath these factors bhi review kijiye. Ek signal par directional trade lena unnecessary risk create kar sakta hai.
Range ke andar patience maintain karna bahut important hota hai. Assuming an early breakout can create a poor entry. Astrological timing without price confirmation provides incomplete market evidence. Isliye written plan mein a clear no-trade condition include kijiye.
6. Intraday Timing Windows Need Proper Testing
The speaker revisits Nifty candles around 9:40 and 12:45. He also mentions certain times for a following session, which we do not repeat here because listing them could read as a trade call. Aise timings ko historical data par test kiya ja sakta hai. However, one successful example does not provide meaningful proof.
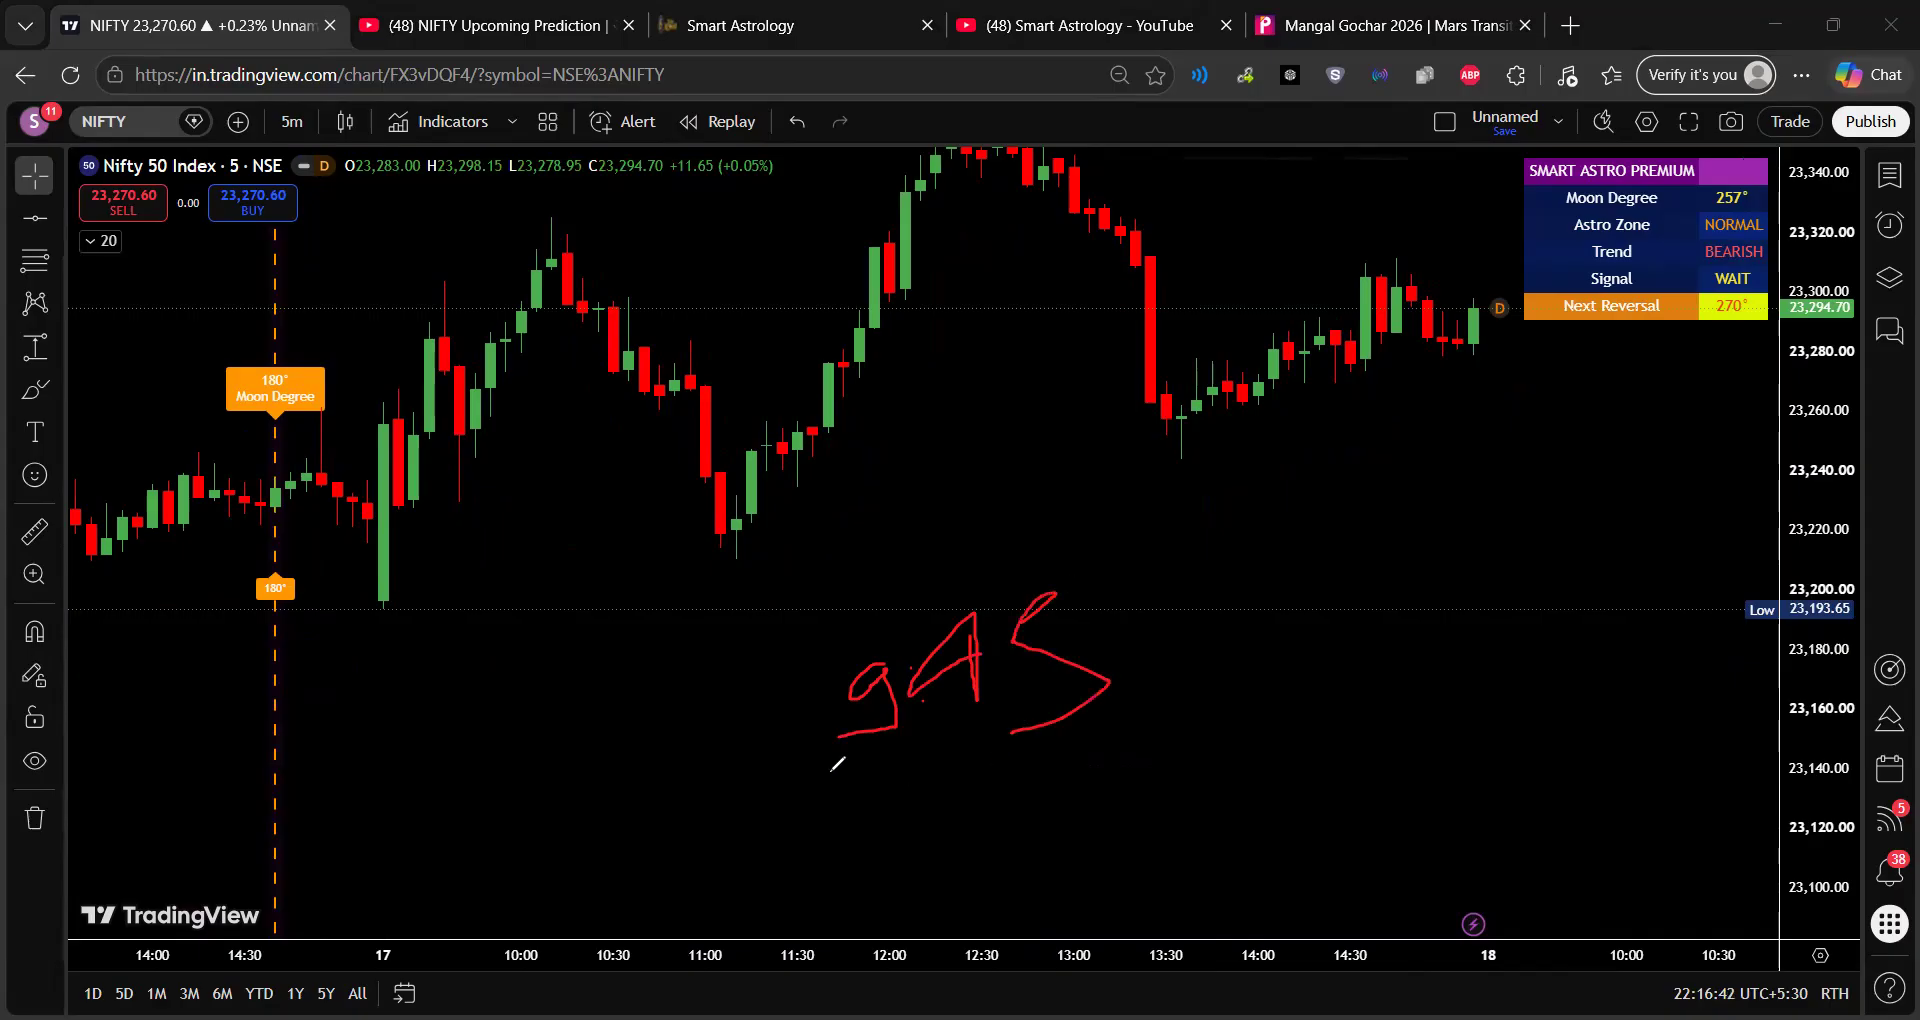
Before testing any timing, define the permitted time tolerance. Also define reversal size, breakout confirmation, stop placement, and observation period. Losing and inactive examples ko bhi complete dataset mein include kijiye. Costs and slippage should remain part of every realistic evaluation.
Use an equal observation window around every highlighted time. Selecting only exact turning candles creates strong hindsight bias. Neutral sessions ko dataset se remove nahi karna chahiye. A complete sample reveals the method’s actual consistency more clearly.
7. How Confirmation Bias Can Distort Backtesting
Confirmation bias appears when successful examples receive more attention than failures. Hindsight also makes historical charts appear easier than live decisions. Outcome pata chalne ke baad almost any candle meaningful lag sakti hai. A written research process helps reduce this problem.
Whenever possible, record the hypothesis before the market session. Save its exact wording, direction, timing, invalidation, and observation period. Afterwards, classify every outcome through the same predefined rules. Apni preferred explanation bachane ke liye rules change mat kijiye.
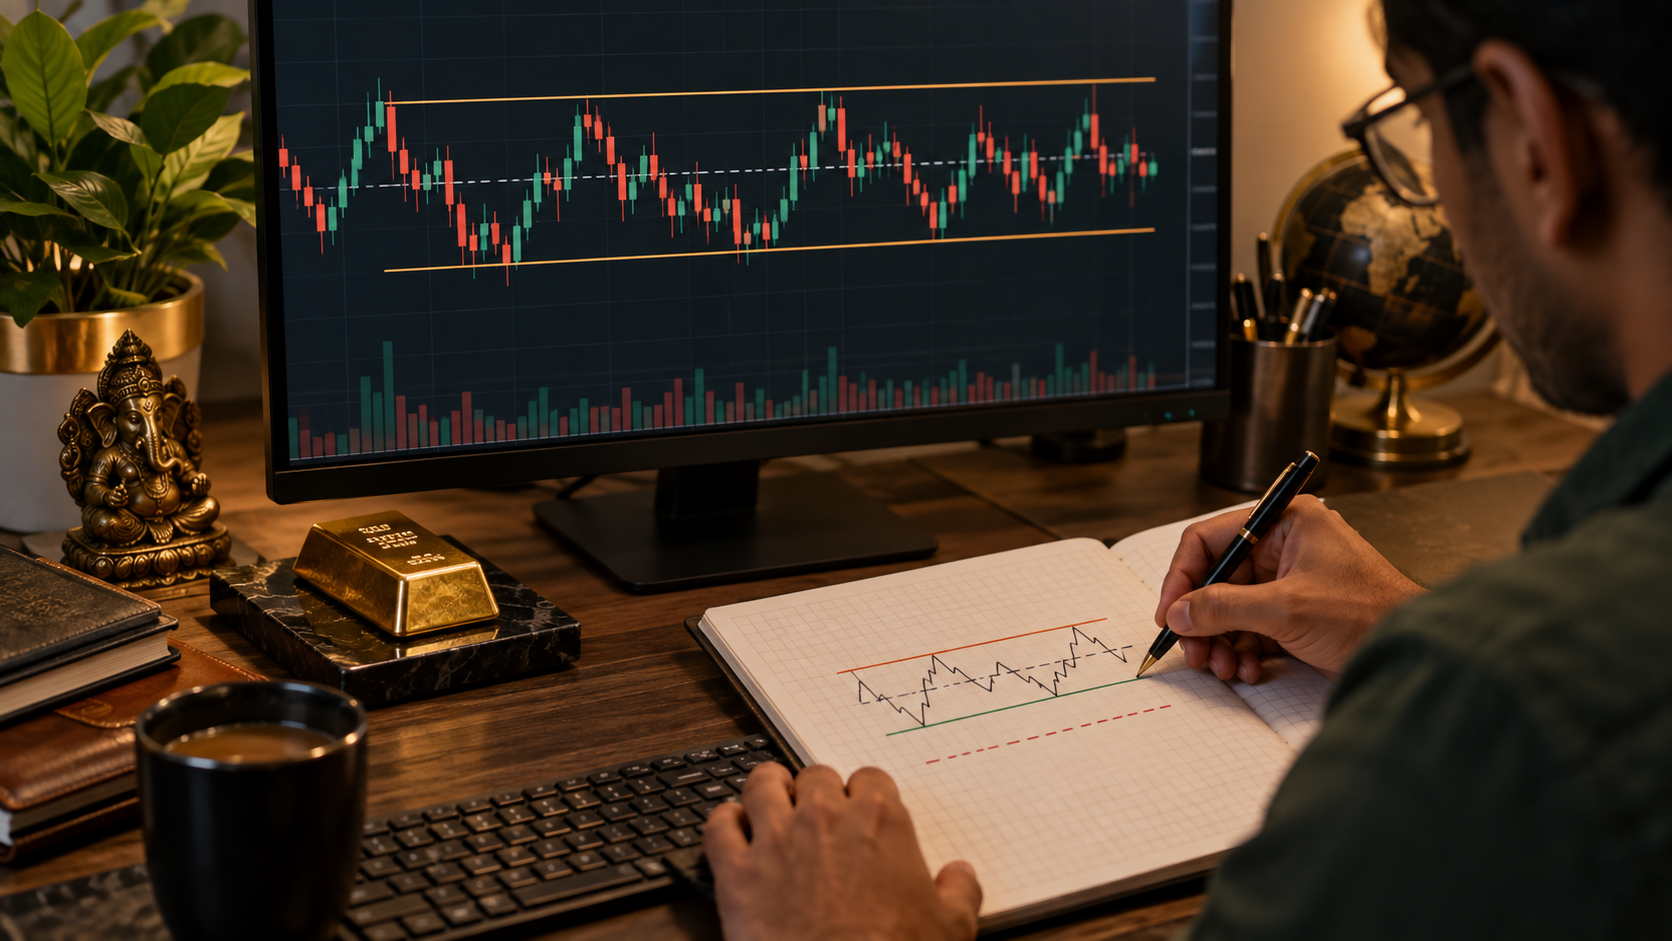
8. A Practical Financial Astrology Research Journal
Financial astrology ko trading instruction nahi, research hypothesis samajhiye. A structured journal separates the astrological event from market evidence. It also prevents memory from rewriting vague expectations after outcomes appear. Isse review zyada factual aur consistent ban sakta hai.
| Journal Field | What to Record |
| Astrological event | Planet, transit, aspect, source, timezone, and exact timestamp |
| Market instrument | Nifty, Bank Nifty, gold, futures, or another defined market |
| Pre-event hypothesis | Expected volatility window without guaranteed direction |
| Price evidence | Open, previous close, gap size, range, volume, and candle behaviour |
| External context | Global cues, scheduled data, policy news, currency, and commodities |
| Risk plan | Entry condition, invalidation, quantity, maximum loss, and no-trade condition |
| Outcome review | Hit, miss, ambiguous result, costs, execution, and lesson |
Journal mein screenshots ke saath original hypothesis bhi preserve kijiye. Rewriting explanations afterwards can make the analysis unreliable. Paper trades aur actual trades ko separately tag karna useful hai. Dono categories different execution behaviour reveal kar sakti hain.
Structured record keeping samajhne ke liye hamari Trading Journal guide read kijiye.
9. Build a Test Before Building a Belief
Sabse pehle ek clearly written hypothesis prepare kijiye. Ask whether next-session gaps appeared more frequently near defined transit dates. Collect every qualifying event across several years. Then compare those results with the market’s normal gap frequency.
Direction aur volatility ko separately analyse karna zaroori hai. A method may identify activity without predicting upward or downward direction. Study Nifty and gold independently because their market drivers differ. Finally, verify the rule on fresh data not used earlier.

10. Risk Management Comes Before Any Timing Method
Koi timing method market uncertainty completely remove nahi kar sakta. This applies to Nifty, Bank Nifty, gold, and derivatives. Decide maximum acceptable risk before entering any position. Confident commentary, dates, or indicators dekhkar exposure increase mat kijiye.
Real-money application se pehle paper testing complete kijiye. Compare planned entries with actual execution and transaction costs. When evidence does not match the predefined setup, avoid trading. Kisi framework ko prove karne se zyada capital protection important hai.
Entry se pehle maximum risk rupees mein clearly define kijiye. Record every stop-loss change and its reason immediately. Consecutive losses ke baad position size automatically increase mat kijiye. Your capital-protection process always deserves the highest priority.
11. What SEBI Investor Guidance Means Here
SEBI investor education warns against assured returns and near-certain claims. It also cautions investors about unregistered advice and unsolicited tips. Its learning resources specifically discourage astrological investment decisions. Jab market content certainty dikhaye, these warnings become especially important.
Definite gaps, guaranteed reversals, fixed accuracy, ya monthly income kabhi promise nahi karne chahiye. Readers should conduct independent research and verify an adviser’s registration. Personalised investment guidance SEBI-registered professionals se hi leni chahiye.
12. A Balanced Way to Use the Video
Use the video to understand one financial-astrology framework. Note the Mars transit, earlier dates, candle midpoint, gold range, and timings. Har observation ko ek separately testable question mein convert kijiye. Historical chart convincing lage, tab bhi us trade ko copy mat kijiye.
Sabse useful approach observation aur proper documentation ka combination hai. Compare the video’s ideas with historical data, chart context, and news. Apply strict risk rules throughout the entire review. Evidence inconsistent rahe, toh us conclusion ko honestly accept kijiye.
Frequently Asked Questions
Is financial astrology scientifically proven for market prediction?
No established evidence guarantees that planetary transits predict market direction. Treat financial astrology as an interpretive research framework, not verified forecasting certainty.
Does Mars transit guarantee a Nifty gap?
No. Gaps can arise from many overnight and market-specific factors. Transit dates can be studied historically, but they cannot guarantee a gap.
Can a fifty-percent candle retracement be considered a rule?
No. It is a chart reference requiring defined testing. Some candles retrace, while others continue or reverse differently.
Why can astrology websites show different transit dates?
Calendars may use different zodiac systems, locations, timezones, and calculation conventions. Always record the exact source used.
Should traders use the video’s intraday timings directly?
No. Specific timings require broad historical testing, confirmation rules, costs, and risk limits before any practical consideration.
How should beginners explore this topic?
Begin with paper observations. Maintain a journal, include every result, compare non-event sessions, and avoid real-money decisions based on untested claims.
Can astrology replace technical or fundamental analysis?
No single framework captures every market driver. Price, liquidity, macroeconomic information, news, and risk management remain important considerations.
What is the safest takeaway from this discussion?
Study claims systematically, avoid certainty, protect capital, and seek regulated guidance whenever personalised investment advice is required.
Is this article investment or trading advice?
No. This article explains the supplied video for education only. It does not recommend any security, position, entry, exit, target, or stop-loss. Readers should consult a SEBI-registered professional before any financial decision.
Conclusion
The Mars transit discussion creates several research questions for Nifty and gold. These cover gaps, large-candle retracement, consolidation, and intraday timing. Lekin observations disciplined testing ke baad hi meaningful bante hain. Honest documentation remains essential throughout that process.
Financial astrology ko certainty ya direct trading signal nahi samajhna chahiye. Interested readers may study it as an evidence-based hypothesis. Record every success, failure, and unclear result consistently. Markets uncertain hain, isliye risk management ko greater importance dijiye.
Watch the complete video, note each hypothesis, and test it through historical charts before drawing conclusions. Explore LogicIQ Pro Academy for structured market education, chart-reading practice, risk awareness, and disciplined review methods.
Continue Learning with LogicIQ
Maintain your observations through our Trading Journal guide.
New market participants can read our Demat Account opening guide.
Explore more beginner-friendly learning on the LogicIQ Pro Academy website.
Sources and Verification Notes
Video discussed: https://www.youtube.com/watch?v=JL0cObgrs60
SEBI Investor – Video Based Learning Modules: https://investor.sebi.gov.in/inv_aware_edu_videos.html
SEBI Investor – How to Spot a Scam: https://investor.sebi.gov.in/spot-any-scam.html
SEBI Investor – Factors to Consider Before Investing: https://investor.sebi.gov.in/investment-thingsbeforeinv.html
Vedic transit-date reference: https://vedicmarga.com/transit/mars/in-cancer/
Disclaimer
⚠ IMPORTANT EDUCATIONAL DISCLAIMER
LogicIQ Pro Academy is an educational institution. It is NOT registered with SEBI as a Research Analyst, Investment Adviser, Portfolio Manager, or in any other regulated capacity. SEBI has not approved or endorsed this article, the academy, or its courses, tools and services. This article is intended solely for education and general market awareness. Financial astrology is discussed as an interpretive framework and research topic. Nothing here constitutes investment advice, a research recommendation, a live trading call, or a solicitation to buy or sell securities or commodities. Astrological dates, historical charts, technical levels, and past observations do not predict or guarantee future market outcomes. Trading and investing involve market risk, including possible capital loss. The views and study presented in the video belong to Sanjay Kumar, founder of Smart Astrology; LogicIQ Pro Academy is not affiliated with those views and does not endorse them. Readers should conduct independent research, verify current information, apply suitable risk controls, and consult a SEBI-registered professional where appropriate. LogicIQ Pro Academy does not manage reader accounts and accepts no responsibility for individual trading decisions.